
Figure 4.
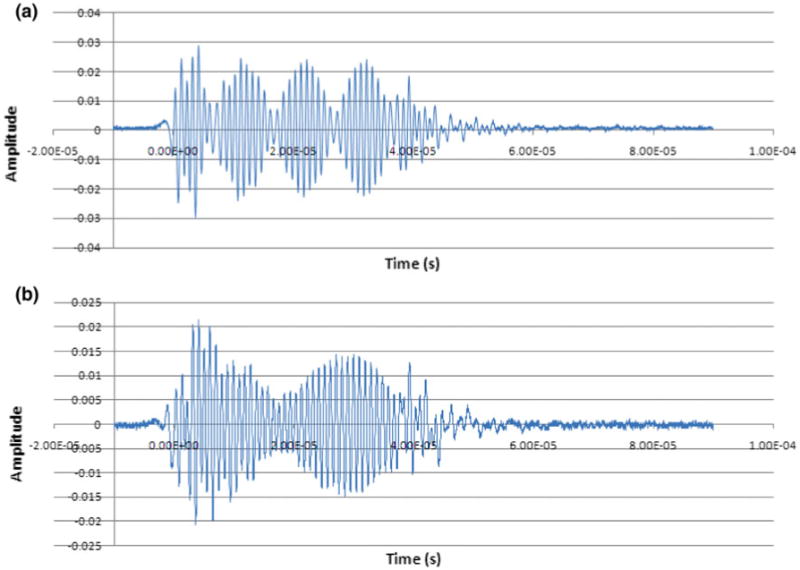
The acoustic waveform for amplitude modulated ultrasound measured at the focal zone. Graphical representation of beat waveforms detected at the focal point. In both graphs ‘a’ and ‘b’, the experimental modulation frequency (fe) was approximately same as the theoretical modulation frequency (fm). (a) Frequency 1 (f1) = 1.10 MHz, frequency 2 (f2) = 1.1 MHz, Δf = 100.0 kHz, fe = 50.0 kHz, fm = 47 kHz; (b) f1 = 1.1 MHz, f2 = 1.045 MHz, Δf = 45.0 kHz, fe = 22.5 kHz and fm = 22.9 kHz.