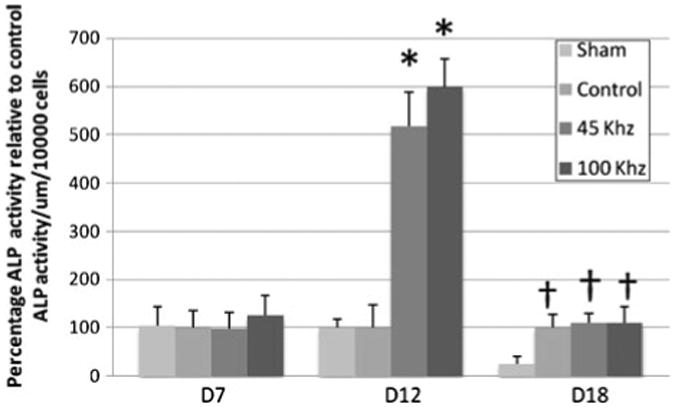
Figure 5.

Alkaline phosphatase enzymatic activity in pAMUS, LIPUS and no ultrasound cultures. Alkaline phosphatase activity of cultures of MC3T3-E1 at day 7,12 and 18, ultrasound treatments were given for 15 min per day. Alkaline phosphatase results were normalized to number of cells. Cultures were distributed in four groups, cultures with no ultrasound treatment (sham), pulsed ultrasound stimulation (control), 45 kHz and 100 kHz pulsed amplitude modulated ultrasound (pAMUS) stimulated group. Each data point is representative of the mean of five independent experiments per time point ± standard deviation. 45 kHz and 100 kHz pAMUS stimulated cultures show significant increase of 4 and 5 fold (*p < 0.001, n = 5) in comparison to pUS stimulated cultures and non-treated cultures at Day 12. At day 18 there is no significant difference between pAMUS and LIPUS stimulated cultures, ultrasound treated cultures show significant increase relative to non-treated cultures (†p < 0.01, n = 5). Statistical significance was calculated by student t-test and one-way ANOVA.
