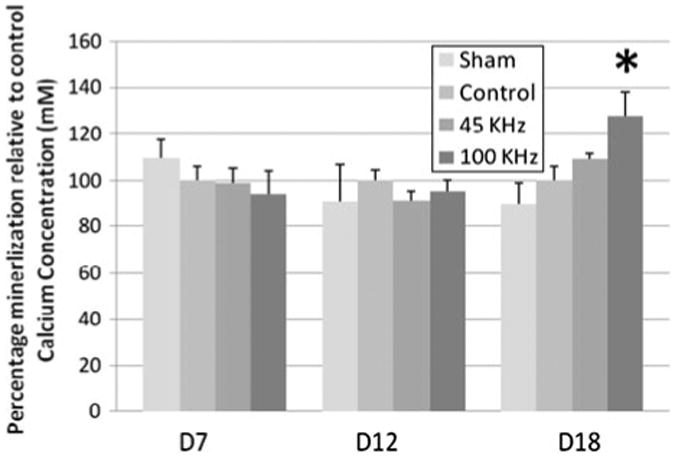
Figure 8.

Callcium Mineralization assessment at day 7, 12 and 18 in MC3T3-E1 cultures using calcium regeant assay relative to LIPUS cultures. Alizarin red staining results were confirmed using calcium reagent assay at OD650nm. pAMUS and LIPUS samples were stimulated for 15 min everday. Statisitically significant increase(27.75 ± 10.13%, *p < 0.05, n = 5) in 100 kHz pAMUS stimulated cultures at day 18 relative to pUS stimulated cultures. No significant change was observed between 45 kHz pAMUS and LIPUS stimulated cultures. Significance was calcuated by Student t-test and one-way ANOVA, error bars represent ± standard deviation.
