
Figure 1. Parp1 promotes OSKM-mediated iPSC generation.
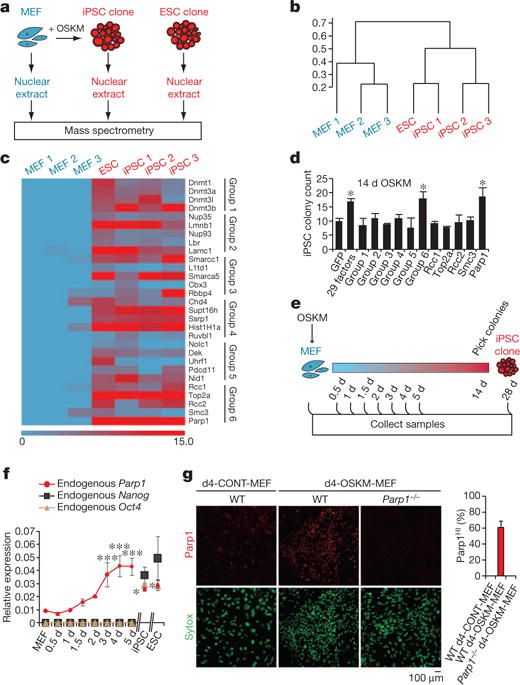
a, Diagram of proteomic strategy to identify candidate epigenetic modification (EM) factors. b, Unsupervised hierarchical clustering analysis (Spearman rank correlation) of mass spectrometry data from nuclear extracts of MEFs (n = 3), iPSCs (n = 3) and ESCs (n = 1). The scale bar represents the correlation height (= 1 − Abs[correlation]). c, Dual-colour heat map for expression levels of 29 proteins highly enriched in both the iPSC and ESC samples (relative to MEFs). The colour scale bar represents the spectral count. Candidate EM factors were divided into six groups for further functional testing. d, Functional screen of candidate EM factors for promotion of somatic cell reprogramming in OSKM-MEFs. EM candidates were transduced together as a single pool of 29 genes, as 6 subpools, or as individual factors from group 6 (as in c). Alkaline phosphatase-positive (AP+) iPSC colonies were counted at day 14 after transduction with OSKM. e, Diagram of time-course analyses of iPSC reprogramming. f, Gene expression time course of endogenous Parp1, Nanog and Oct4. g, Immunocytochemistry analysis of WT or Parp1−/− d4-OSKM-MEFs and d4-CONT-MEFs with an antibody against Parp1 (upper panels; red), and counterstained with Sytox nuclear marker (lower panels; green). Increased Parp1 expression in d4-OSKM-MEFs is quantified on the right (Parp1HI; defined as mean plus 2 s.d. or greater than the expression level in d4-CONT-MEFs); modified nuclear morphology apparent in d4-OSKM-MEFs is as described previously30. Results in d, f and g are shown as means and s.d. for three independent experiments. Asterisk, P < 0.05; three asterisks, P < 0.001.