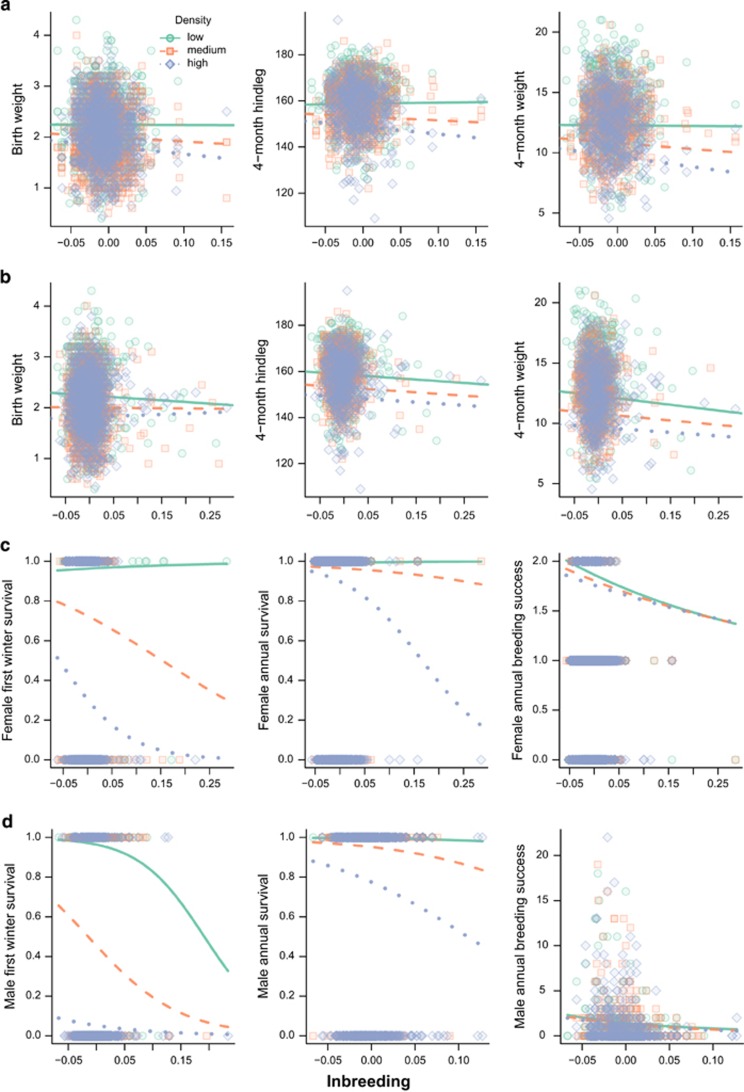
Figure 3.
The effect of inbreeding (FGRM) on juvenile weight (a and b) and three fitness components in females (c) and males (d). Row (a) shows the effects of maternal inbreeding depression and all other rows show the effects of inbreeding depression expressed through the focal individual. Symbols representing the raw data are colour coded based on population density by dividing the population densities into three sets of equal size, and the fitted lines represent predicted values for the midpoints of each group (low: 311, medium: 481, high: 611). Note that the only formally significant interactions were in birth weight (interaction between maternal inbreeding and density, P=0.045; see Table 3) and in adult female annual survival (interaction between inbreeding and density, P=0.02; see Table 3) and neither would survive Bonferroni correction. A full color version of this figure is available at the Heredity journal online.

