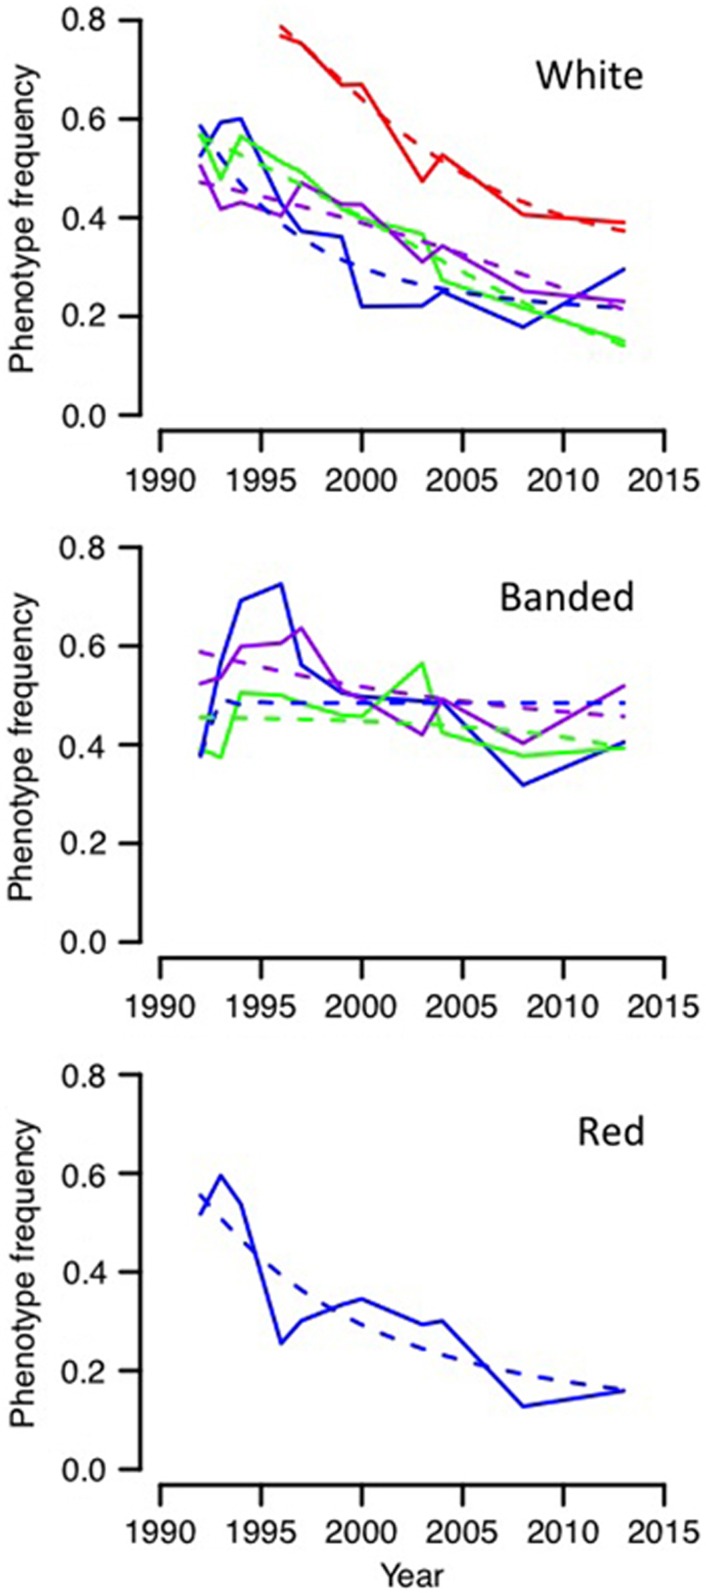
Figure 3.
Frequencies of colour phenotypes in skerry populations from 4 months after the manipulation in 1992 to 2013 (solid lines). Fitted declines in frequencies under a model of frequency-dependent selection (broken lines). Populations are coded as follows. (Top) White-1, blue; White-2, green; White-3, purple; White-4, red. (Mid) Banded-1, blue; Banded-2, green; Banded-3, purple. (Bottom) Red, blue.

