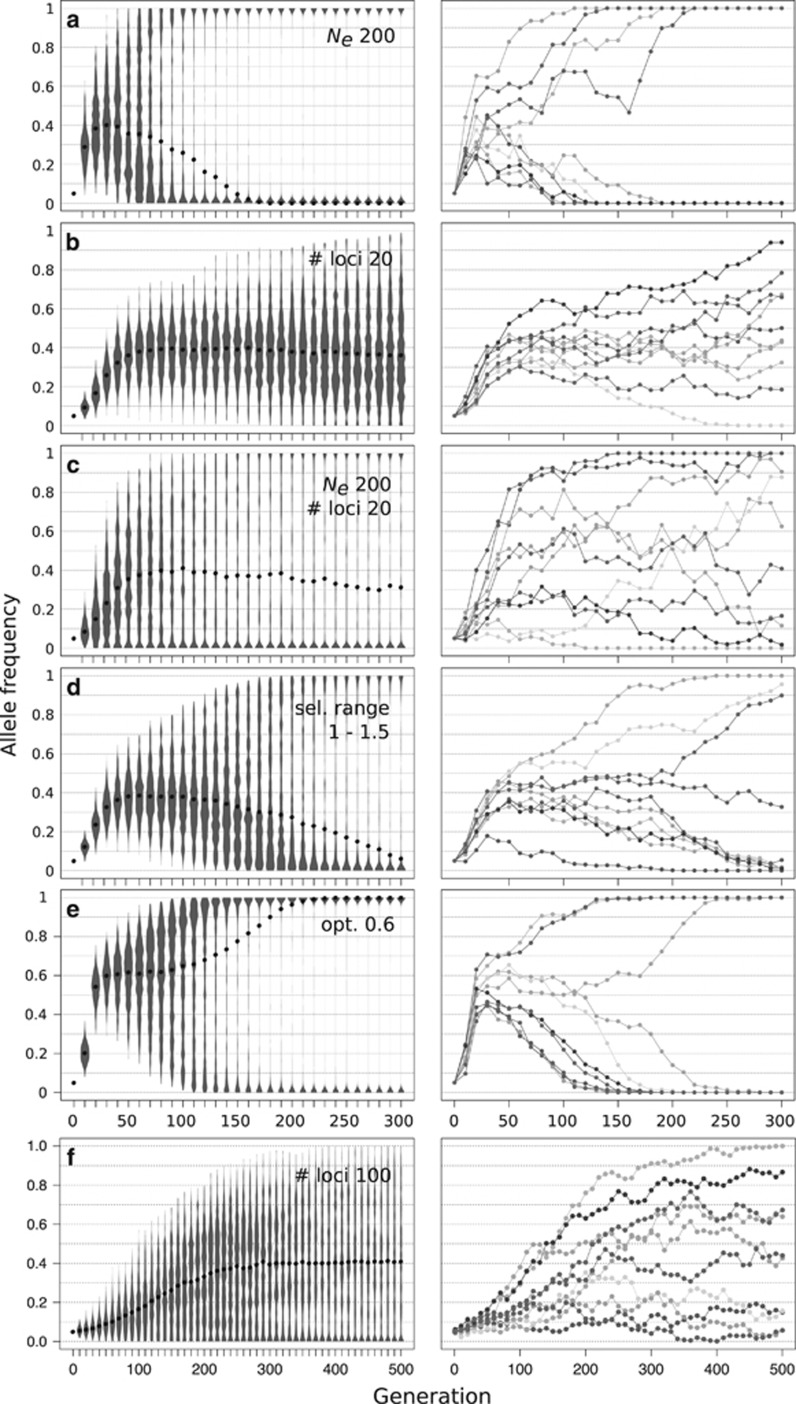
Figure 3.
Influence of experimental parameters and quantitative trait architecture on the 3 characteristic phases of trait adaptation to a new intermediate trait optimum. Simulations were performed with the default parameters (Table 1). Parameters deviating from the default are shown in the insets (a–f). Left panels summarize the trajectory of a single locus across 500 replicate simulations in violin plots, black dots indicate the median. The right panel shows corresponding example trajectories of a single locus in 10 independent replicates. The modified parameters have a clear influence on the length and/or distinctiveness of the 3 characteristic phases. Note, medians over time indicate the behavior of the majority of loci across replicates at the focal site. Means are expected to remain constant at the frequency corresponding to the optimum phenotype.

