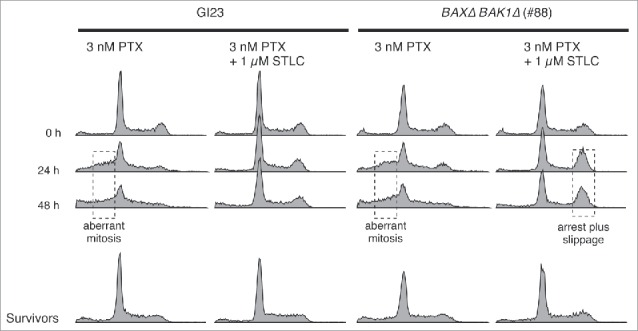
Figure 6.

DNA contents of apoptosis-prone and -reluctant cells during and after drug treatment. Surviving cells were cultured in fresh medium for 5–7 days after the treatment, then fixed and analyzed. Anomaly of the DNA content, probably due to aberrant mitosis or mitotic slippage, is indicated by dotted boxes.
