
Figure 1.
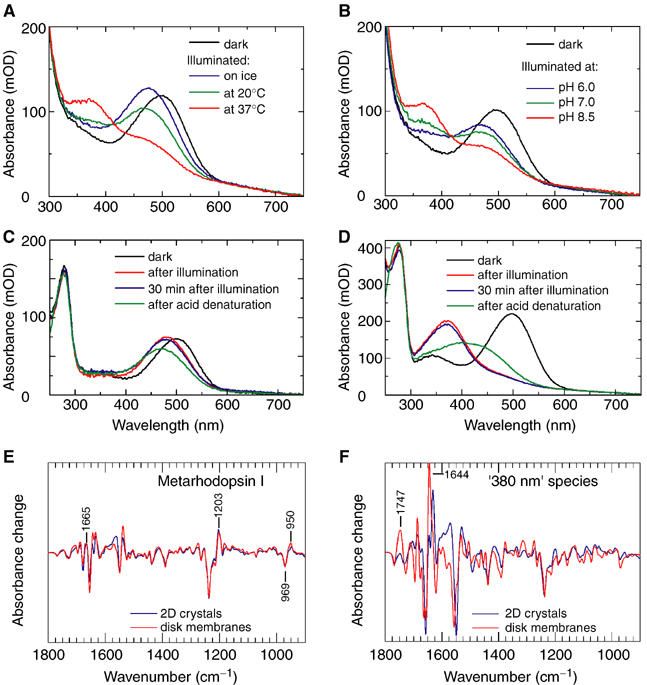
UV/visible spectroscopic analysis of photointermediate formation in 2D crystals. (A) Temperature dependency. The dark spectrum of rhodopsin 2D crystals was recorded in dialysis buffer at 20°C, pH 7.0. Spectra were then recorded after illuminating 2D crystals in the same buffer at the given temperature. (B) pH dependency. The dark spectrum was recorded in dialysis buffer at 30°C, pH 7.0. Spectra were then recorded after illumination of the sample in dialysis buffer at 30°C and a given pH. (C) Protocol for trapping meta I in 2D crystals. A suspension of 2D crystals was incubated on ice, and its spectrum was recorded at 1–2°C (black line). The crystals were illuminated on ice for 1 min with light filtered to contain only wavelengths greater than 515 nm. The absorption maximum shifts to 480 nm following illumination, corresponding to the formation of meta I (red line). Four cryoelectron microscopy grids were then prepared. A further spectrum was recorded (blue line). Finally, sulphuric acid was added to the photometer cell until the pH was between 1.0 and 3.0 (green line). (D) Formation of a species absorbing at 380 nm in 2D crystals. A suspension of 2D crystals was incubated at 45°C, and its spectrum was recorded at 45°C. The crystals were illuminated for 1 min with light filtered to contain only wavelengths greater than 515 nm. Spectroscopy reveals a shift in the absorption maximum to 380 nm following illumination. Several characteristics of this photointermediate led us to conclude that it does not correspond to meta II. (E, F) FTIR difference spectroscopy of rhodopsin in 2D crystals compared to rhodopsin in its native (disk) membrane. The absorbance change is shown at the same scale in both spectra. (E) FTIR difference spectra of meta I. The spectrum for the 2D crystals was obtained in 200 mM MES and 200 mM NaCl at 3°C, pH 7, from the same batch of crystals used in the structure determination. The spectrum for rhodopsin in disk membranes was obtained at 10°C, pH 8.5 (see Vogel et al, 2004 for a corresponding UV/visible spectrum). (F) FTIR difference spectra of species absorbing at 380 nm. The spectrum for the 2D crystals was obtained at 45°C, pH 7. The spectrum for rhodopsin in disk membranes was obtained at 20°C, pH 5, conditions that produce meta II in the membrane (see Vogel et al, 2004 for a corresponding UV/visible spectrum).