
Figure 5.
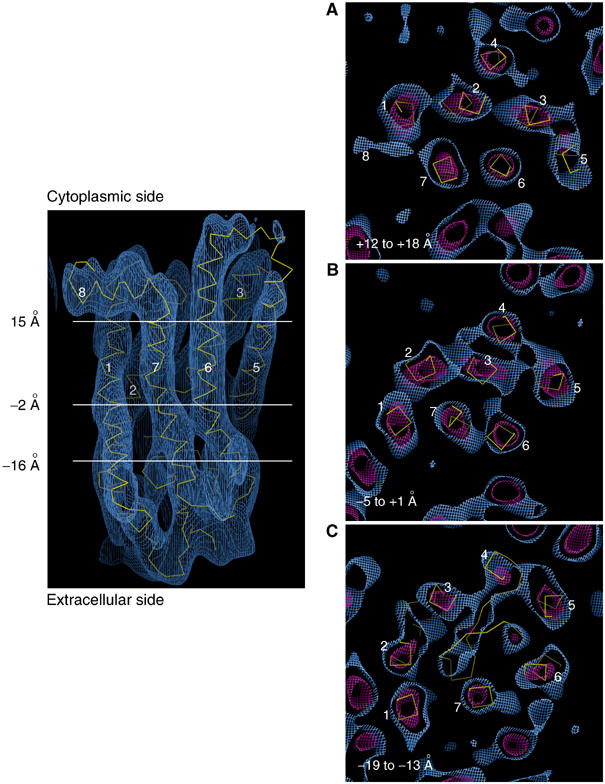
Sections (6 Å) through the density map perpendicular to the membrane plane, viewed from the cytoplasmic side. Helices are numbered. (A) Section at +12 to +18 Å, towards the cytoplasmic side. (B) Section at the position of the chromophore (−5 to +1 Å). (C) Section at the level of the extracellular plug (−19 to −13 Å), showing density associated with several extracellular loops. The side view is shown at the 1σ contour level. For (A–C), the blue density is at the 0.6σ level, and the red density is at the 3.6σ level.