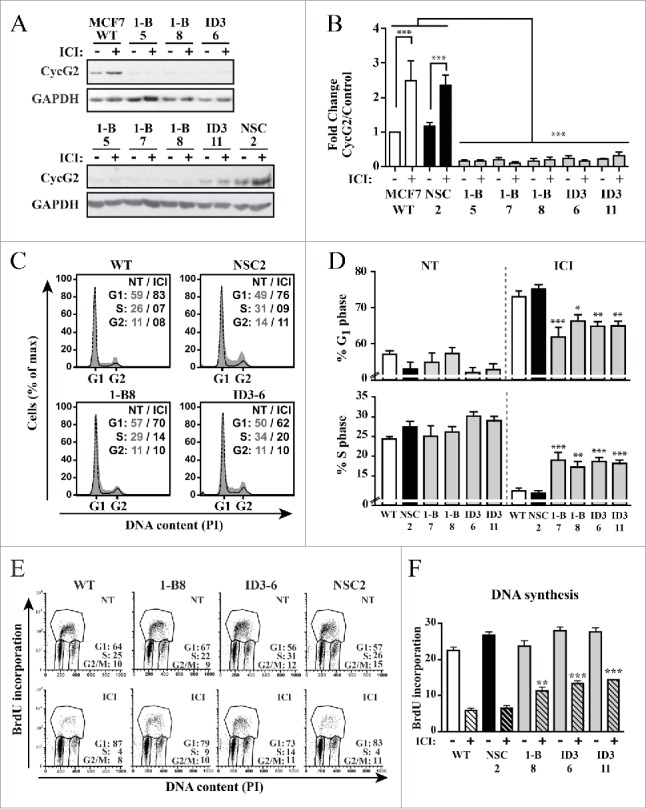
Figure 4.

Silencing CycG2 expression reduces the cell cycle inhibitory effects of fulvestrant-mediated ER signaling blockade. (A) Immunoblots of CycG2 levels in indicated MCF7 CycG2 KD clones and controls (NSC, WT) following 48 h culture in the presence (+) or absence (-) of fulvestrant (ICI, 100 nM). (B) One-way ANOVA statistical analysis of CycG2 expression data from >3 replicate experiments quantified by immunoblotting as in A. (C) Representative histogram overlays of DNA content in parental MCF7 control (WT, NSC) and CycG2 KD clones cultured in normal (gray area, NT) or ICI (black line) containing medium for 48h). (D) Statistical analysis (one-way ANOVA) of G1- and S-phase DNA distribution data of flow cytometry analyses as shown in C. (E) Two-parameter flow cytometry analysis of BrdU-labeled DNA in CycG2 KD clones and WT and NSC controls cultured with (ICI) or without (NT) fulvestrant. (F) One way ANOVA analysis of BrdU data from >3 repeats of experiments shown in E. ***p = < 0.001; **p = < 0.01; *p = < 0.05.
