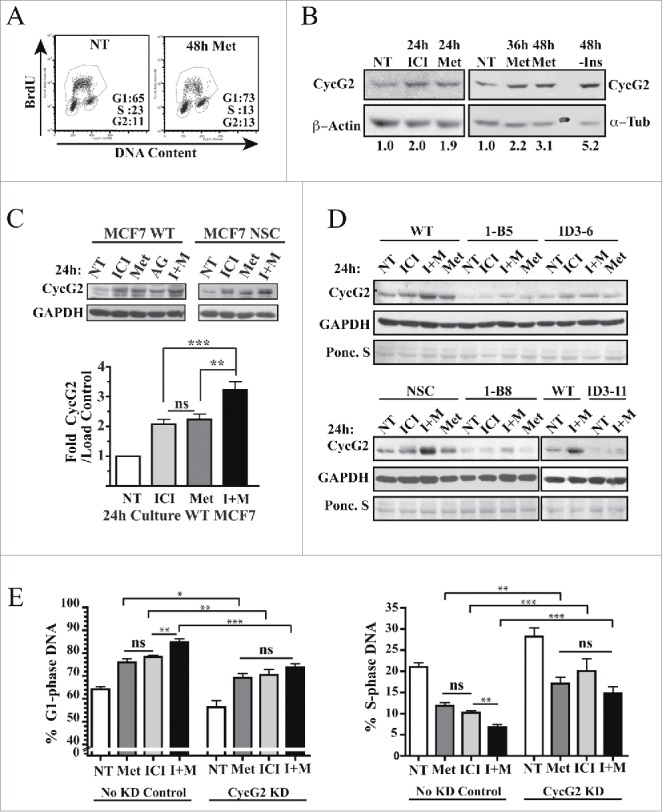
Figure 7.

CycG2 contributes the cell cycle inhibitory effects induced by metformin. (A) Two parameter DNA flow cytometry analysis of DNA synthesis (BrdU incorporation) and cell cycle status of metformin treated cultures of MCF7 WT cells. (B) Immunoblot of CycG2 vs. loading control signals (α-tubulin, β-actin) in MCF7 WT cells cultured in normal medium (NT) or in the presence of metformin (Met,1 mM), or fulvestrant (ICI, 100 nM) or in the absence of insulin (-Ins) (C) Top, representative immunoblots show metformin (Met) enhancement of fulvestrant (ICI)-induced CycG2 expression in MCF7 control (WT, NSC) cultures I + M = fulvestrant + metformin; AG = 10 μM IGF-1R inhibitor AG1024. Bottom, statistical analysis of CycG2 expression in MCF7 WT cells treated for 24 hours with either metformin, fulvestrant or both agents. (D) CycG2 expression in CycG2 KD clones (1-B, ID3) treated for 24 hours with either metformin, fulvestrant or both agents compared to similarly treated MCF7 controls. (E) Statistical analysis of (one-way ANOVA) bar graphs of G1- and S-phase DNA distribution data. MCF7 control and CycG2 KD cultures that were treated for 24 h with metformin or fulvestrant alone or in combination. ***p = < 0.001; **p = < 0.01; *p = < 0.05.
