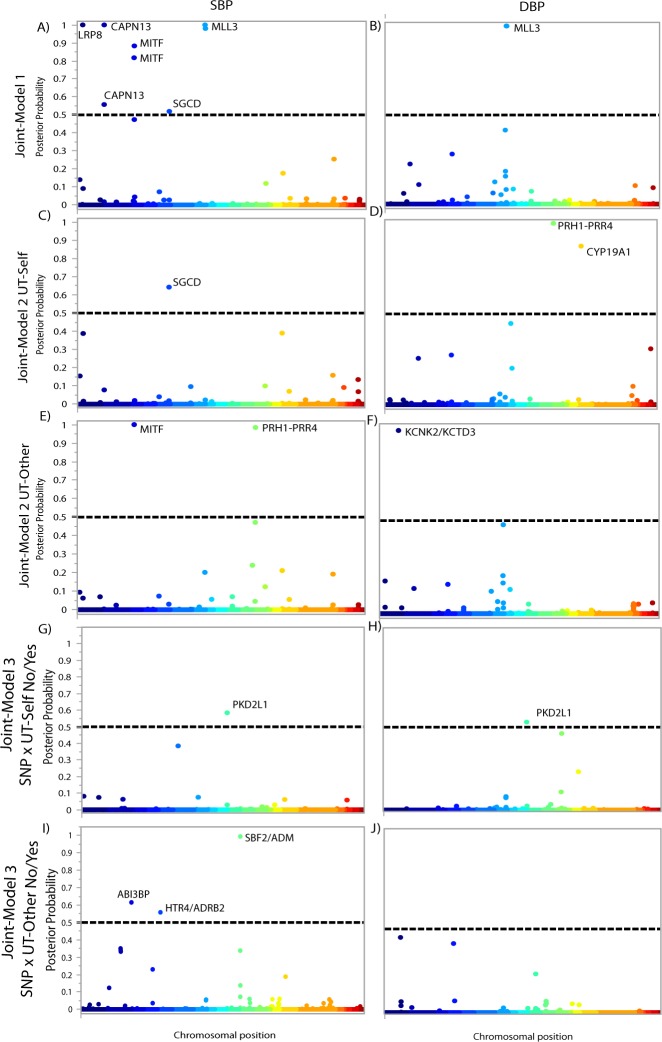
Fig 2. Bayesian Manhattan plots for joint ancestry and association testing with BP.
Each association is plotted based on its chromosomal position (x axis) and the posterior probability that a locus affects BP (y axis). The dashed line indicates the threshold for genome-wide significance (posterior probability ≥0.5). Model 1 results are shown for A) SBP and B) DBP. Model 2/UT-Self plot for C) SBP and D) DBP. Model 2/UT-Other plot for E) SBP and F) DBP. Model 3/UT-Self No/Yes plot for G) SBP and H) DBP. Model 3/UT-Other No/Yes plot for I) SBP and J) DBP.

