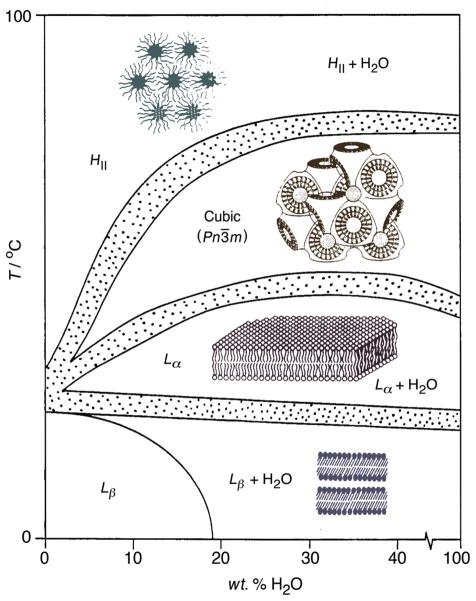
Figure 2.
Membrane lipid curvature underlies the temperature-composition phase diagrams of phospholipids. Lipid head groups are indicated by circles and acyl chains by wormlike strings. Hypothetical phase diagram shows the sequence of microstructures with greater tendency to curve towards water as temperature rises; the phase boundaries are described by the Gibbs phase rule. At lower temperatures lamellar microstructures are found where the gel state (Lβ; also known as solid-ordered) has trans acyl chains. The lamellar liquid-crystalline state (Lα; also known as liquid-disordered) is found at higher temperature and has liquid-like chains with gauche defects. Further increasing the temperature yields the cubic phase with a curved lipid film draped upon a lattice of cubic symmetry. Lipidic (bicontinuous) cubic phases with zero mean curvature (Pn3̄m based on the Schwarz D-surface; or Im 3̄m based on the Schwartz P-surface, also known as the “plumber’s nightmare”) entail a labyrinth of two nonpenetrating aqueous regions separated by a lipid film; there is no aqueous path from one side to the other. At higher temperature the HII reverse hexagonal phase (type 2, with negative curvature towards water) involves lipid cylinders whose diameters depend on the water content. Note that distinction in terms of solid-ordered (so), liquid-disordered (ld), and liquid-ordered (lo) phases (rafts) is inapplicable to describing membrane curvature. [single column - 3 inch width]

