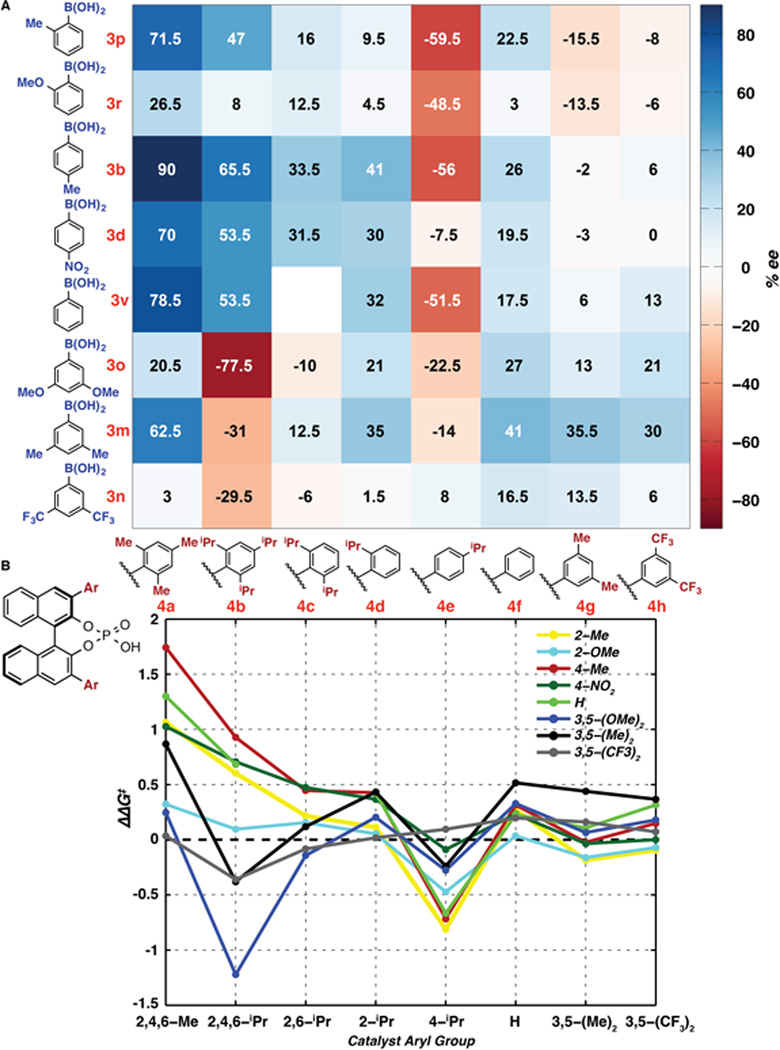
Figure 4.
(A) Enantioselectivity data obtained by variation of PA and BA substitution pattern. All reactions were conducted using 0.050 mmol 1, 0.065 mmol 3, 0.065 mmol Selectfluor, 0.200 mmol Na2HPO4, 0.005 mmol 4, and 40 mg MS 4Å in toluene (0.1 M). (B) Graphical representation of BA structure–selectivity trends as a function of catalyst structure.

