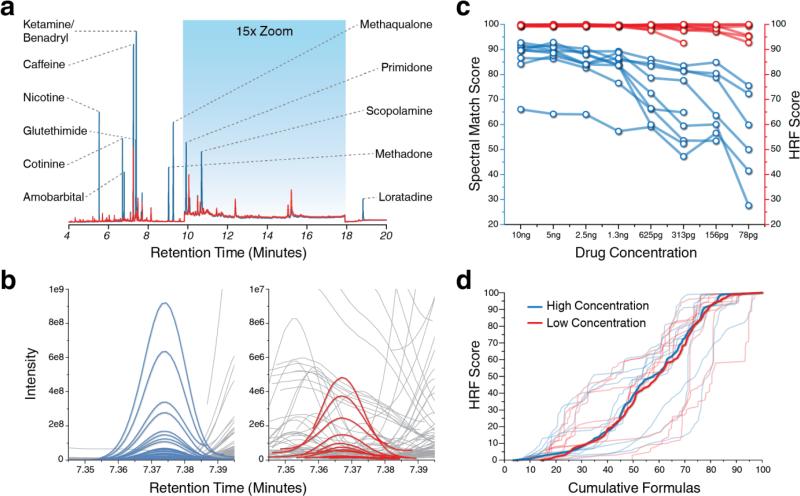
Figure 3.
Analysis of drugs spiked into human urine at variable concentration. (a) GC-MS TIC chromatograms from the most concentrated (blue) and least concentrated (red) spiked samples are shown. (b) Deconvolved feature groups for the drug Glutethimide at high (blue) and low (red) concentrations. Background features are shown in gray. (c) Spectral match and HRF scores for each drug analyzed at all concentrations where analyte abundance was sufficient to produce a spectrum. (d) Two spectra were isolated for each drug (one at the most concentrated point, the other at the least) and 55,290 HRF scores were calculated using unique formulas (0-500 Da) in the NIST database. Cumulative HRF results are shown for each drug using a spectrum acquired at high and low concentration (blue and red, respectively). A combined distribution is also shown for each population of drug spectra.

