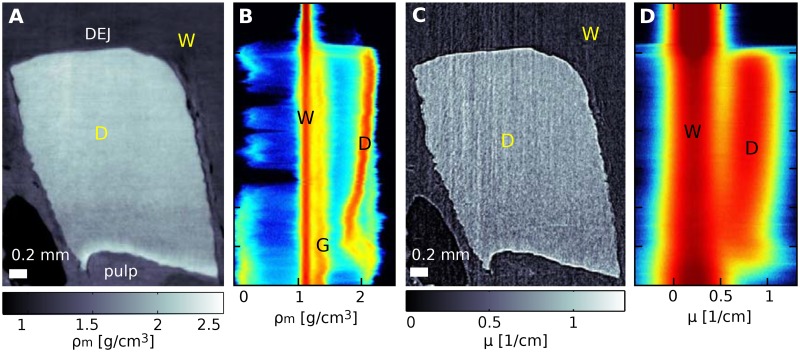
Fig 3. Phase and absorption sagittal slices of sample G and two-dimensional histograms of the entire volumes.
Panels A and B show a sagittal slice from the phase volume of sample G and the two-dimensional histogram of the same volume respectively (see S2 Appendix). This data is compared with the corresponding absorption slice (panel C) and absorption histogram (panel D). The vertical axis in the sagittal slices and 2D histograms indicates the height in the volumes.

