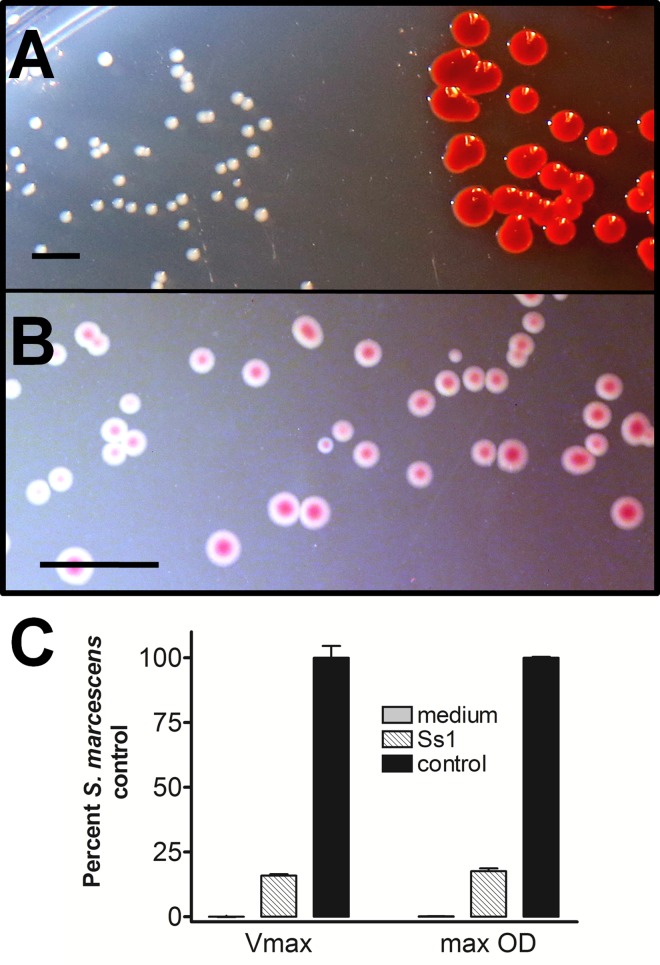
Fig 6. Colony phenotype characterization of Ss1.
A) Side-by-side comparison identifies the smaller nonpigmented colonies of Ss1 (left) relative to the red-pigmented S. marcescens #361 control colonies (right) after 72 hours incubation at 22°C on LB agar. B) Following a five day incubation on MacConkey agar at 22°C, well-isolated colonies of Ss1 were about 1.5 mm in diameter, and when illuminated from below, showed burgundy-colored centers. C) Liquid growth characteristics of Ss1 (striped bars) were compared to the S. marcescens control strain (black bars), with reference to the growth medium alone (shaded bars). Values are expressed as a percentage of the control strain. Both the maximum growth rate (Vmax) and the maximum optical density at 600 nm (OD) of Ss1 showed significant (P<0.05) reduction when compared with the control strain. Liquid growth dynamic analyses were performed on three separate days with similar results. The scale bar in Figs A and B each represent 5 mm.

