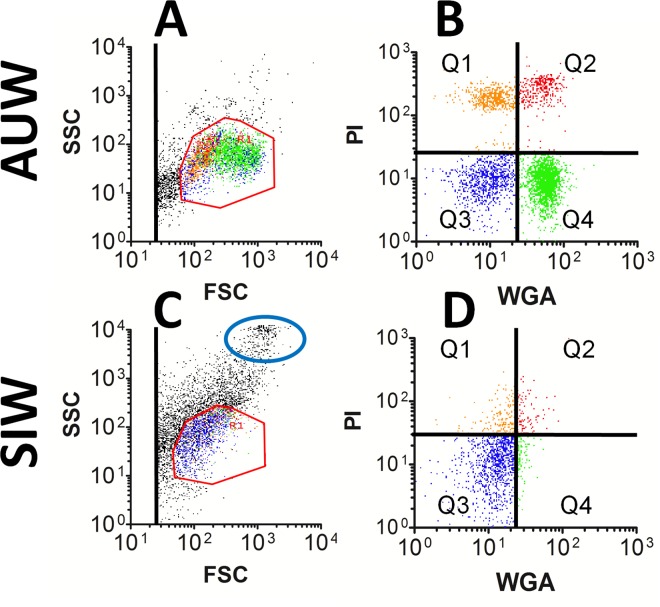
Fig 7. Hemocyte profiling by flow cytometry comparing normal and Ss1-infected bees.
Hemolymph was collected from bees and probed with WGA-FITC and PI as described in the Methods. Data are shown for hemolymph particulates representing one AUW (A and B) and one SIW (C and D). FSC versus SSC identify physical parameters of the hemolymph particulates as shown in A and C, while green and red fluorescence values of the particulates included only in the red octagon gate are shown in B and D. SIW suggest a significant reduction in the abundance of circulating hemocytes represented in quadrants Q1, Q2, and Q4, but not in microparticles appearing in Q3. In SIW, the FSC versus SSC plots also indicate an increased number of large particulates (blue oval), consistent with the presence of pollen grains.

