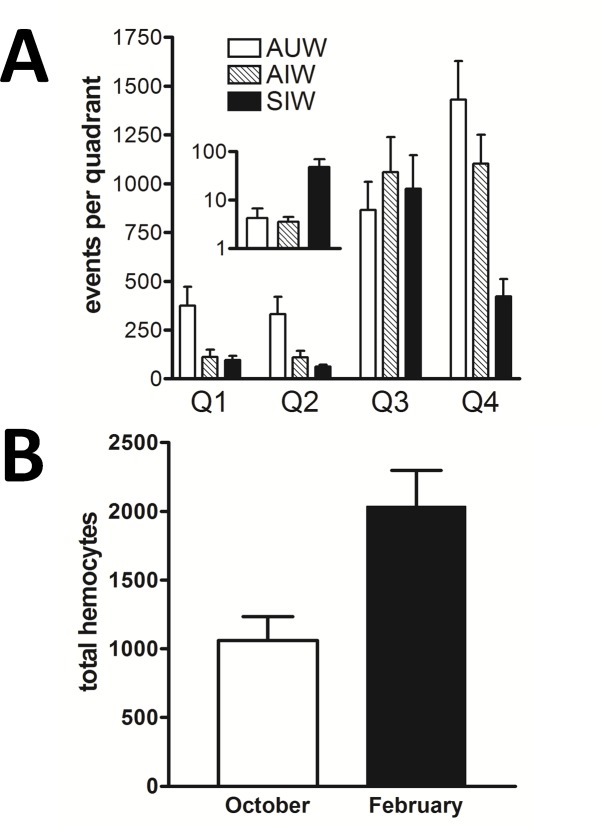
Fig 8. Flow cytometry comparison of hemolymph particulates.
A) For each group of live bees examined (AUW, AIW, and SIW) bars represent values from 16 individual bees, for each of the four flow cytometry data quadrants. One-way ANOVA confirmed significant differences (P<0.05) for all three hemocyte populations, by comparing AUW to infected bees. We also confirmed that the concentration of large particulates (primarily pollen grains) was significantly higher (P = 0.008) in the hemolymph of SIW (black bar) compared to both AUW (white bar) and AIW (striped bar), as shown in the inset. B) Actively-clustering AUW were sampled on October 2nd and again the following February 11th and subjected to hemocyte profiling. Total hemocyte numbers showed a significant increase (p = 0.0004, n = 16) during that time, identifying a general increase in hemocyte numbers during winter. Fig B supports the view that the hemocyte decrease observed in Ss1-infected bees was not due to seasonal or temperature effect.

