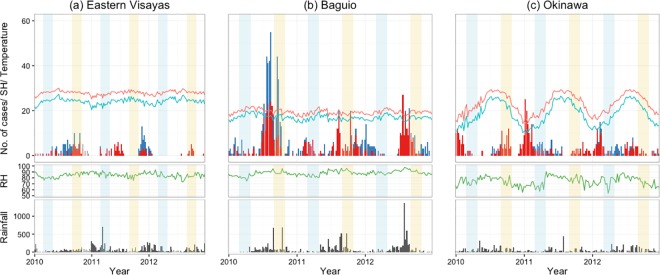
Fig 1.
Weekly climate trends and number of confirmed influenza A (red) and influenza B (blue) cases, detected in (a) Eastern Visayas, (b) Baguio and (c) Okinawa, from January 2010 to December 2012. The black bars (bottom) indicate amount of rainfall and the lines indicate mean temperate (red), specific humidity (SH; blue), relative humidity (RH; green). Light blue and light yellow shaded areas represent the usual timing of influenza vaccination for the Southern (March—April) and Northern (September—October) hemispheres, respectively.

