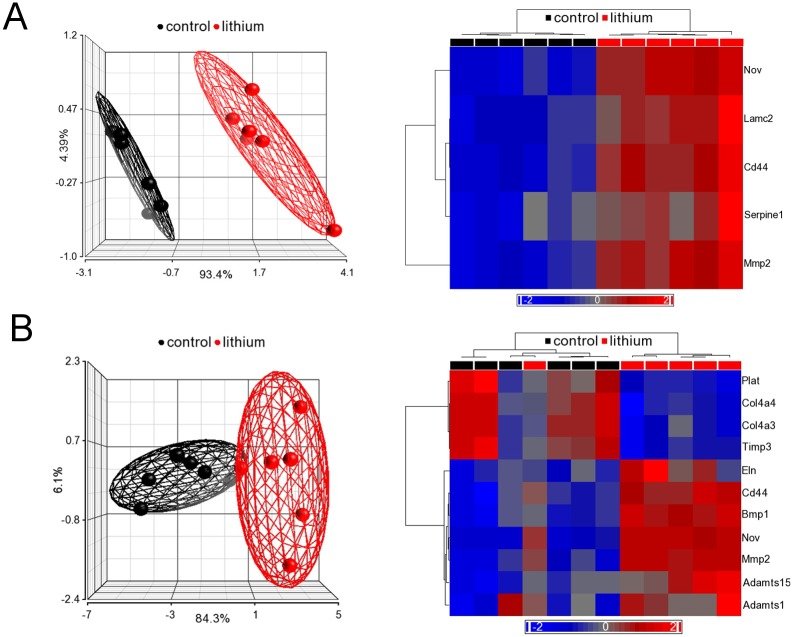
Fig 3. Principal component analysis (PCA) and hierarchical cluster analyses of MARGS in the renal cortex (A) and medulla (B) of kidneys from control and lithium-fed rats (6 months).
A. PCA (left) and hierarchical cluster analysis (right) using 5 MARGS genes from cortex (expression filtered, p-value < 0.05, |FC| > 1.5); B. PCA (left) and hierarchical cluster analysis (right) using 11 MARGS genes from medulla (expression filtered, p-value < 0.05, |FC| > 1.5). MARGS are sufficient to separate the two groups. In PCA, each sphere represents one sample. The ellipsoids represent 95% of the data of a group. In both PCA plots in A and B, red indicates expression above median, blue indicates expression below median. The depth of the colour indicates extent of expression above or below median.

