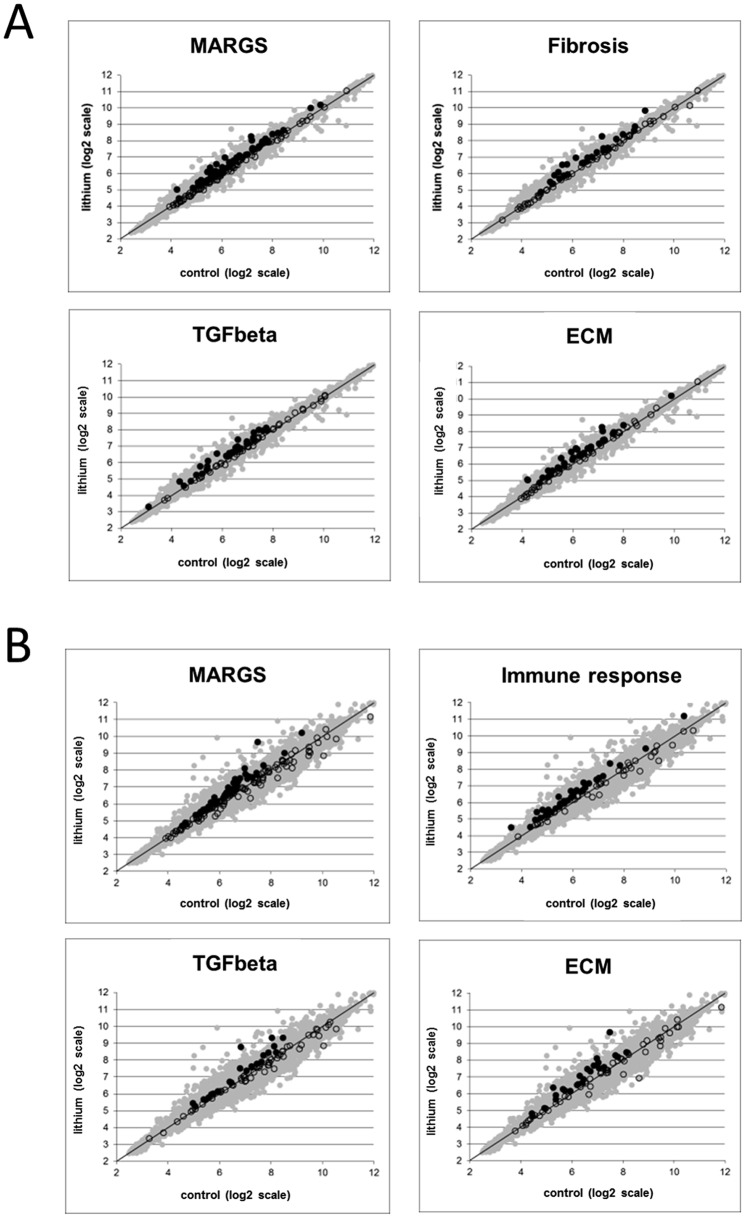
Fig 4. Gene Set Enrichment Analysis with microarray expression data from the renal cortex and medulla of rats fed lithium for 6 months.
The mean signal intensity of a probe set (a surrogate value of expression level) across all lithium-fed samples (y-axis) is plotted against the mean signal intensity across all control samples (x-axis). Each point represents a single probe. (A) Gene sets with functional gene annotation enrichment for MARGS, fibrosis, TGFβ2 and ECM genes in the renal cortex; (B) Gene sets with functional gene annotation enrichment for MARGS, immune response, TGFβ2 and ECM genes in the medulla. With the exception of the MARGS gene set, all gene sets in this figure were extracted from www.SABiosciences.com.

