
Fig 2. Resting-state fcMRI data.
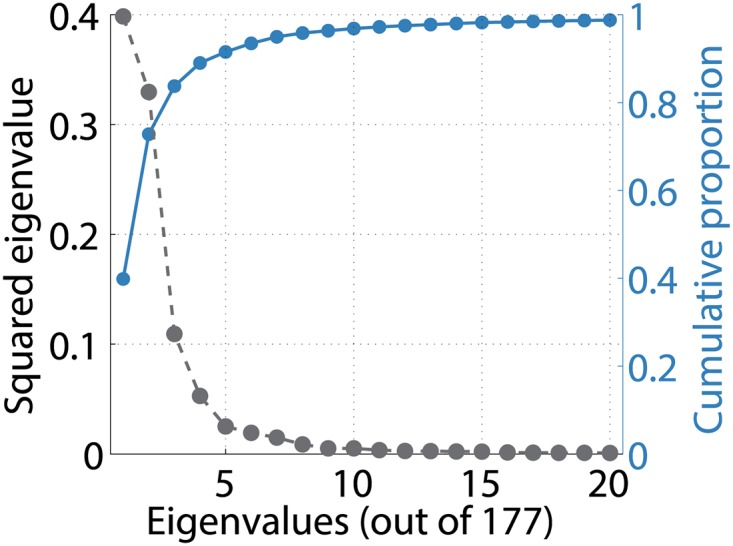
Top 20 squared eigenvalues (black dashed line) of first PCA eigenconnectivity matrix BPCA. Their cumulative proportions (with respect to total of 177 eigenvalues) are shown in right vertical axis (blue solid line).
Official websites use .gov
A
.gov website belongs to an official
government organization in the United States.
Secure .gov websites use HTTPS
A lock (
) or https:// means you've safely
connected to the .gov website. Share sensitive
information only on official, secure websites.
Top 20 squared eigenvalues (black dashed line) of first PCA eigenconnectivity matrix BPCA. Their cumulative proportions (with respect to total of 177 eigenvalues) are shown in right vertical axis (blue solid line).