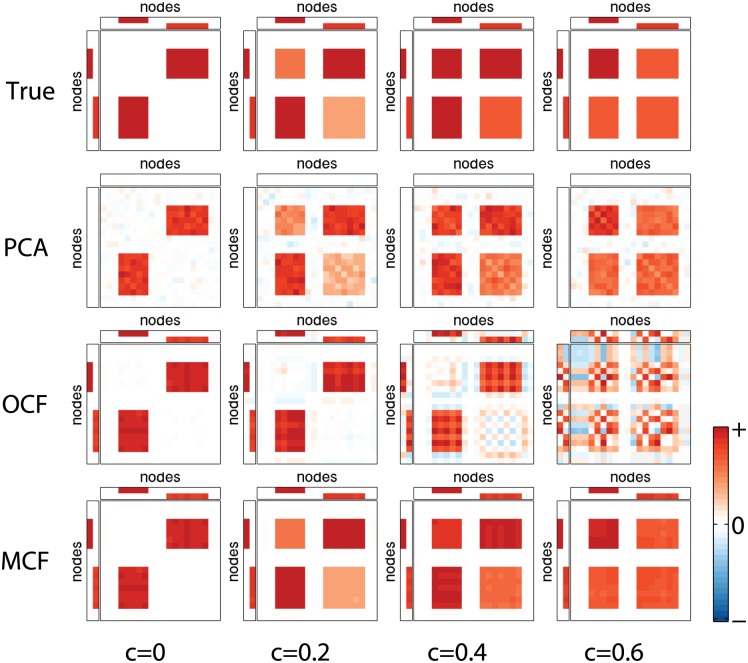
Fig 3. Simulation I: illustrative example.
Each panel in the top row shows a true 20 × 2 weight matrix W = [w1, w2] (as well as its transpose, two small rectangles) and corresponding eigenconnectivity matrix B (large squares). The four panels differ in relative strength c ∈ [0, 1] of intra-module network variability, as indicated at bottom of figure. c = 0 implies no variability within each module and greater c indicates the stronger intra-module variability; in particular, c = 0.6 implies a greater intra-module variability than the inter-module. Bottom three rows show corresponding estimates B by PCA, OCF, and MCF (proposed method), displayed in the same manner. In all panels, red, white, and blue indicate positive, zero, and negative values, respectively (except for weight matrix rectangles in PCA, which are left blank). Each panel and each W and B were scaled individually so that maximum absolute value corresponds to boundary of color range (displayed at bottom right).

