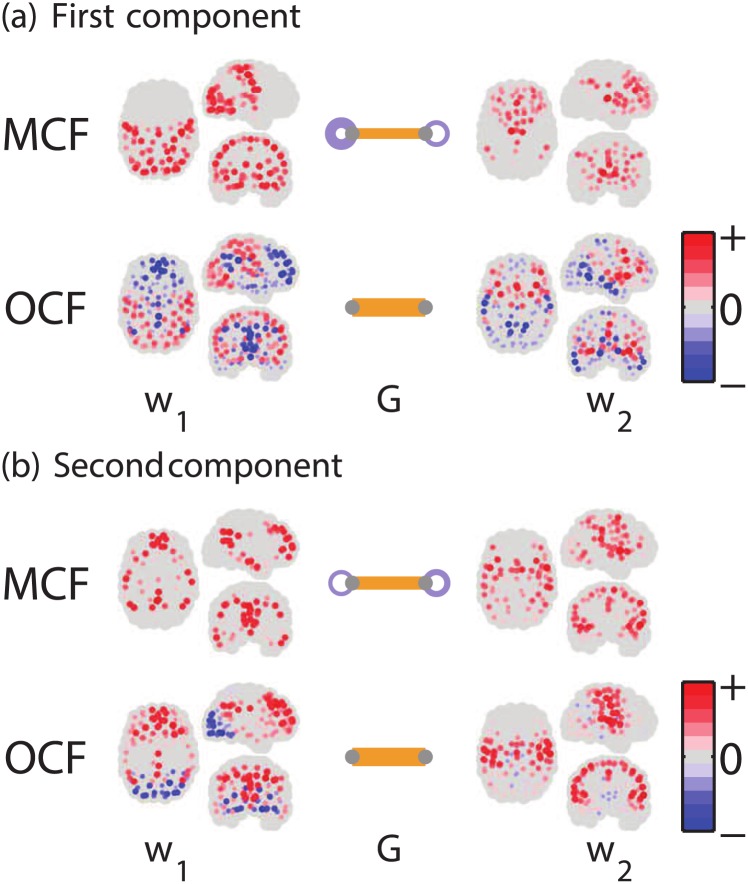
Fig 5. Resting-state fcMRI data.
Spatial patterns of weight vector pairs, w1 and w2, as well as eigenconnectivity G between the two modules, obtained as (a) first and (b) second components of MCF and OCF. Dots display the magnitudes (indicated by color intensity and area and rescaled in each weight vector) and signs (red: positive, blue: negative) of weight values at 177 ROIs. The brain is transparently viewed from right lateral, dorsal, and posterior side. At center of each pair, eigenconnectivity G is represented as a two-node undirected graph. Magnitude of each entry is indicated by width of edge (straight bars: off-diagonal entries, loops: diagonal entries); signs are indicated by two colors (orange: positive, purple: negative).

