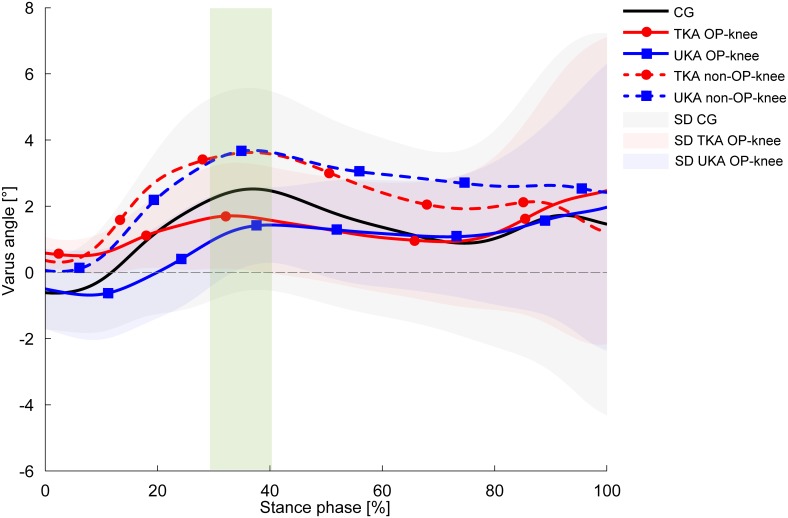
Fig 3. Knee varus angles during decline walking.
Values are presented as mean curves ± standard deviations (SD, shaded areas). Positive values indicate varus alignment. Dotted lines represent the non-OP knee of the TKA group (red) and UKA group (blue). The green rectangle indicates significantly different peak values between the TKA-OP knee and TKA non-OP knee (p = 0.016), the UKA-OP knee and UKA non-OP knee (p = 0.008) for the first 50% of the stance phase.

