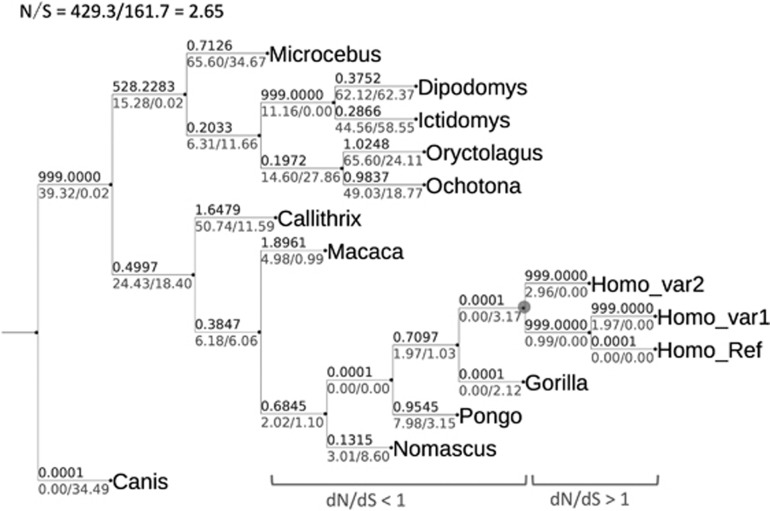
Figure 3.
The dN/dS ratios of different evolutionary lineages in primates. Phylogenetic tree was constructed using neighbor-joining method using IL37 orthologous sequences from multiple species. dN and dS for each evolutionary branch was calculated by codeml of PAML4 with branch model. The values above represent dN/dS ratios and the values below correspond to dN and dS, respectively. The enlarged internal node indicates the MRCA of modern humans. Distinct primate evolutionary phases, labeled as dN/dS <1 and dN/dS >1, are indicated before and after this node.

