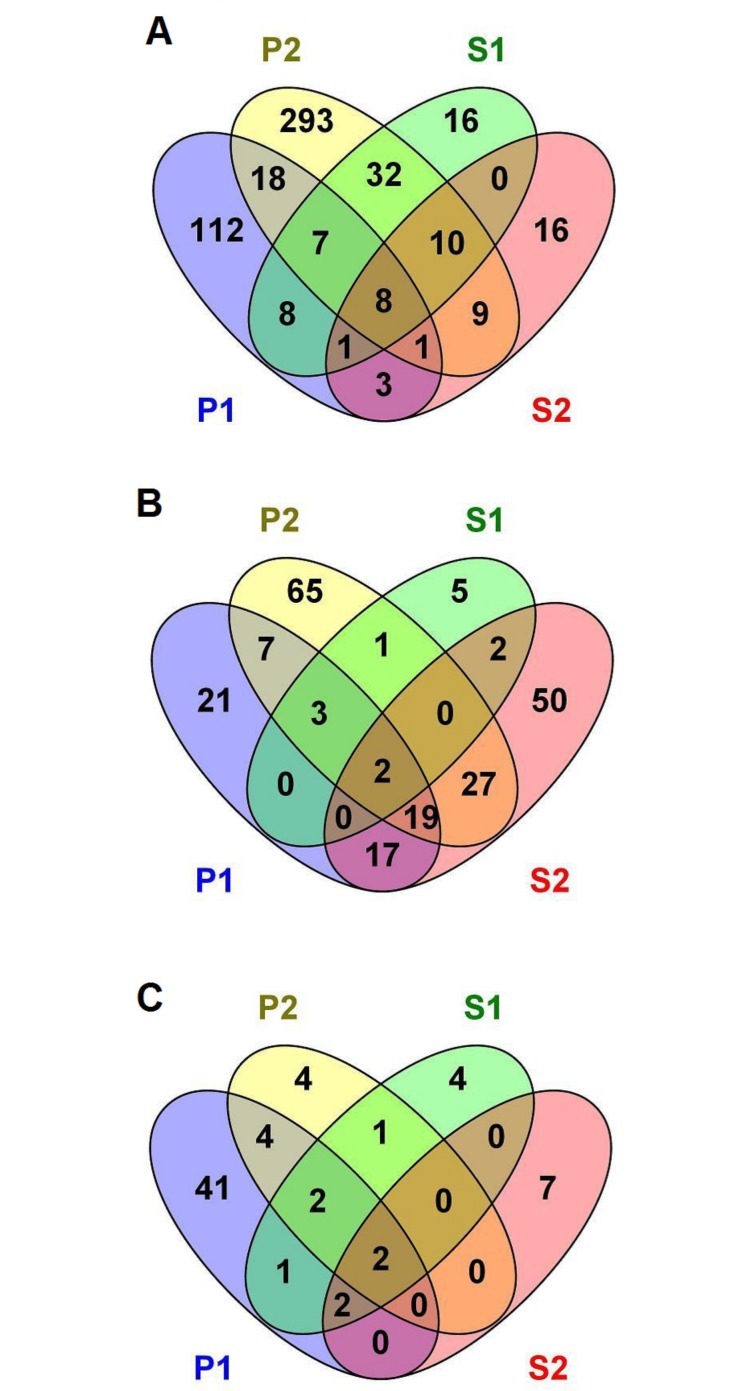
Fig 2.
Venn diagrams: comparison between the number of common and distinct genes between experimental groups in (A) cecal tonsils, (B) spleen, and (C) large intestine. Experimental groups were injected in ovo, with prebiotics: inulin (P1) and GOS (P2), and synbiotics: inulin with L. lactis subsp. lactis IBB 2955 (S1) and GOS with L. lactis subsp. cremoris IBB 477 (S2).

