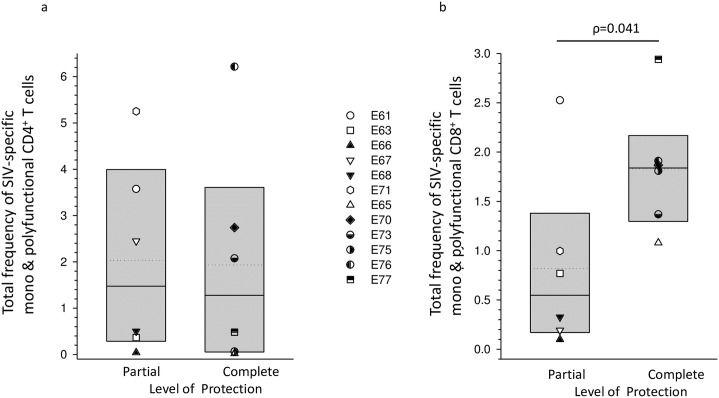
Fig 5. Analysis of total frequencies of SIV-specific mono and polyfunctional circulating T cells on the day of superinfection challenge.
Results for CD4+ cells (a) and for CD8+ cells (b) are shown for individual macaques and as groups based on superinfection protection status. Total frequencies were derived by addition of mono, bi, tri and quadruple functional cells for each peptide pool tested. Box plots show median and mean values with 25th and 75th percentiles. Statistically significant differences for groups are shown as ρ values determined by Mann-Whitney rank sum test.

