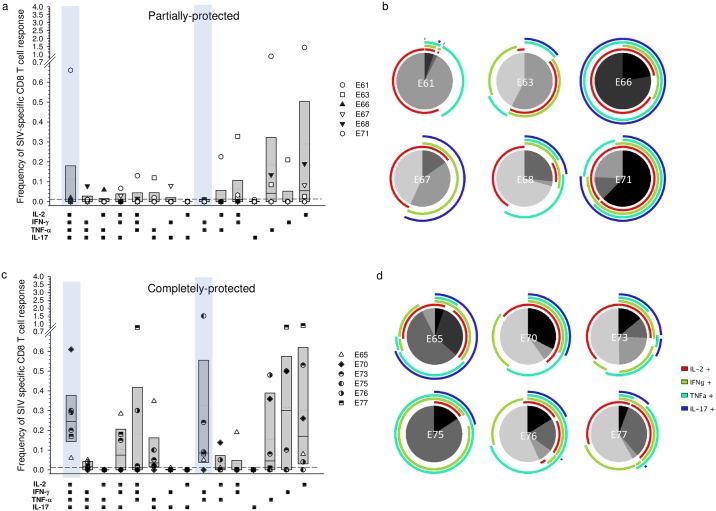
Fig 6. Frequency and distribution of SIV-specific CD8+ peripheral blood T cells on the day of superinfection challenge with respect to protection status.
Cell populations were determined by multi-parametric flow cytometry following stimulation of PBMC separately with SIV-Gag, Rev and Tat peptide pools. Background responses detected in medium alone control samples were subtracted for every combination of cytokines and a cut-off of >0.01% after background subtraction was used as the threshold for positive reactivity (dashed line). Frequencies were derived by addition of results for Gag, Rev and Tat. Box plots show the 25th and 75th percentiles and median (solid line) and mean (dotted line) for each cytokine combination (a & c). Statistically significant differences are highlighted by blue boxes. Proportionate functionality for each macaque (b & d) is shown as a pie chart, with quadruple positivity shown in black and triple to mono positivity shown as shades of grey. Arcs show the combination of cytokine reactivities.

