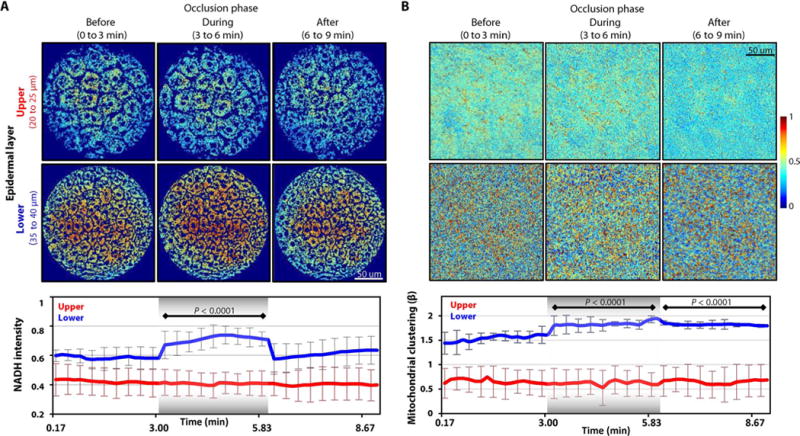
Fig. 1. Endogenous NADH TPEF intensity and mitochondrial dynamics changes in response to arterial occlusion and reperfusion.

(A) Top: Representative scaled in vivo NADH intensity TPEF images for upper and lower human skin layers before, during, and after arterial occlusion. Each epidermal layer was imaged every 10 s for 3 min in each phase. Bottom: The means ± SEM values of NADH intensity extracted from each NADH image of the upper and lower layers (n = 3 independent experiments for each layer). Values extracted during and after the occlusion are compared to those acquired before the occlusion. (B) Top: Corresponding processed cloned NADH intensity images for the upper and lower human skin layers shown in (A). Bottom: The means ± SEM values of the mitochondrial clustering extracted from each cloned image (n = 3 independent experiments for each layer). Values extracted during and after the occlusion are compared to those acquired before the occlusion. For all panels, image heat maps reflect varying TPEF intensities; shaded regions within the bottom panels identify the occlusion phase. P values were determined by mixed-model analyses of variance (ANOVAs) with post hoc Bonferroni correction.
