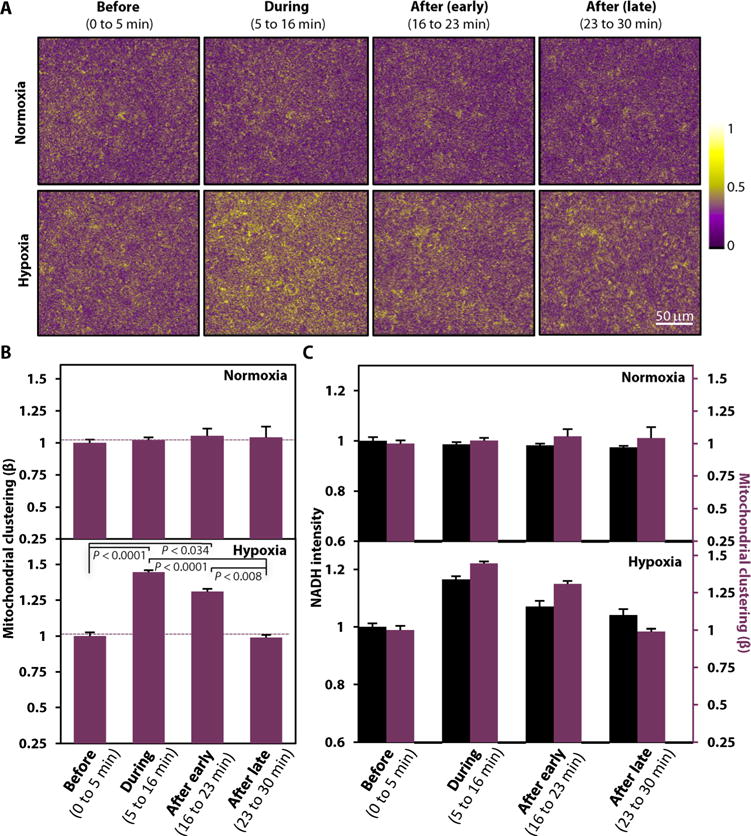
Fig. 3. Hypoxia-induced mitochondrial dynamics of cultured keratinocytes are similar to those observed in vivo.

(A) Corresponding processed cloned NADH intensity images from the normoxic and hypoxic keratinocyte groups acquired before, during, and after (early and late) hypoxia induction as in Fig. 2A. Image heat map reflects varying TPEF intensities. (B) Comparisons of means ± SEM mitochondrial clustering values computed from the cloned images from all experiments performed with NHEKs under normoxic and hypoxic conditions (five independent normoxia and four independent hypoxia experiments; at least three images captured within each experimental phase during each experiment). The mean value in each phase is normalized for each group by its respective “before” baseline clustering. P values indicated in the figure were calculated by a mixed-model ANOVA with post hoc Bonferroni correction. (C) Direct comparison of NADH intensities and respective mitochondrial clustering values [as shown in (B) and Fig. 2B] for each experimental phase for the normoxia- and hypoxia-treated NHEKs. Left: NADH intensity axis. Right: Mitochondrial clustering axis.
