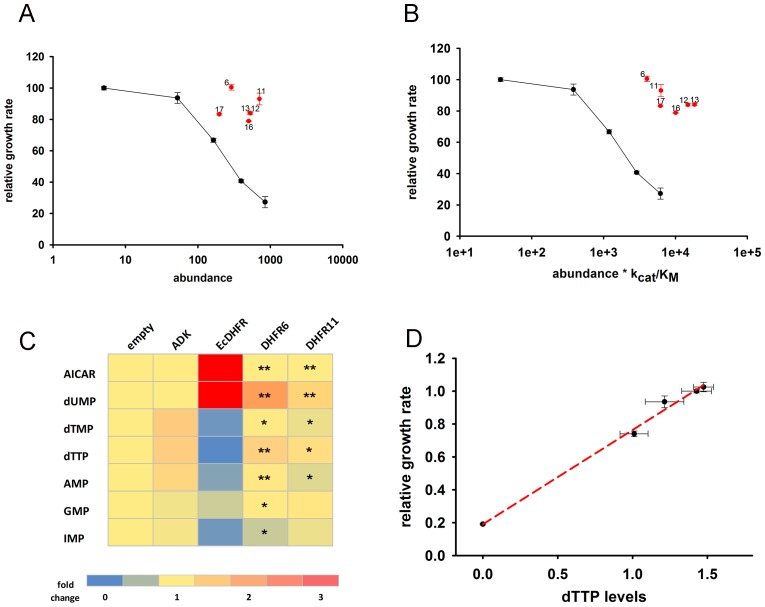
Figure 4. Orthologous DHFR proteins do not cause metabolic imbalance and dosage-related toxicity.
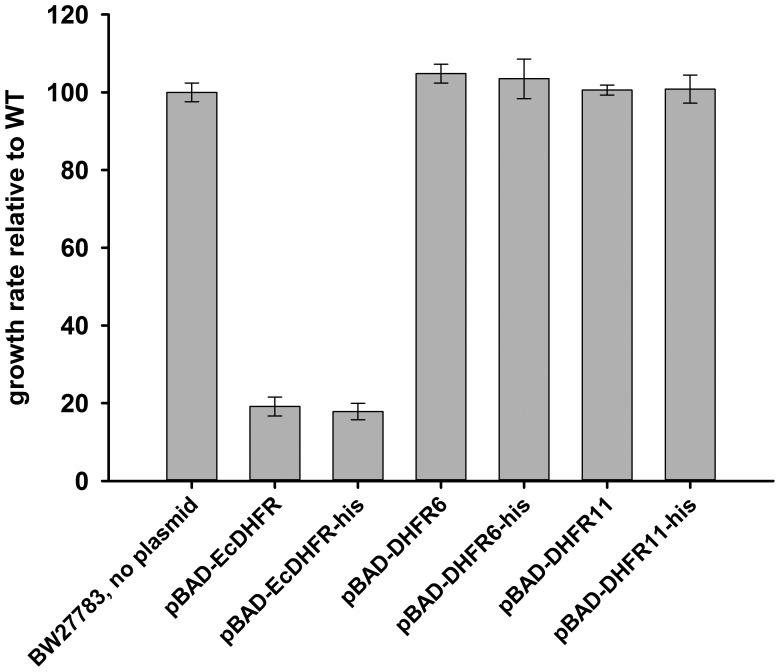
Fitness is shown as a function of (A) intracellular DHFR abundance and (B) (abundance * kcat/KM) for overexpression of E. coli DHFR as well as those from five mesophilic bacteria Listeria innocua (DHFR 6), Bordetella avium (DHFR 11), Leuconostoc mesenteroides (DHFR 12), Aeromonas hydrophila (DHFR 13), Clostridium cellulolyticum (DHFR 16) and Streptococcus dysgalactiae (DHFR 17) expressed from the same plasmid under pBAD-promoter using an inducer concentration of 0.05%. Fitness of cells over-expressing orthologous DHFRs was significantly different from those expressing E. coli DHFR at equivalent concentrations (in all cases, p-value<0.001) (also see Materials and methods) and only endogenous EcDHFR was highly toxic to E. coli. The intracellular abundance of orthologous DHFR was measured by Western Blot with anti-His antibodies (See Materials and methods). Overexpression of orthologous DHFR proteins lacking the His-tag produced identical results (Figure 4—figure supplement 2). (C) Heat-map of the intracellular levels of various metabolites detected in cells overexpressing endogenous ADK and E. coli DHFR as well as two orthologous DHFRs (6 and 11). An empty pBAD plasmid is used as a control. Metabolite levels in orthologous DHFR over-expression were compared to EcDHFR over-expression for statistical significance, where * denotes p-value<0.05 and ** denotes p-value<0.001. Hence when compared to E. coli DHFR, orthologous DHFRs do not cause any major perturbation in the intracellular purine and pyrimidine levels. In all experiments, sample size was three biological replicates. (D) Growth rate of E. coli over-expressing ADK, E. coli DHFR, and orthologous DHFRs 6, 11 and 16 in the presence of 0.05% arabinose is shown as a function of the intracellular dTTP levels. All data were normalized by growth rate of E. coli transformed with the empty plasmid. The data shows that fitness is tightly correlated to cellular metabolite levels (Pearson r = 0.99, p=0.0002).
DOI: http://dx.doi.org/10.7554/eLife.20309.008


