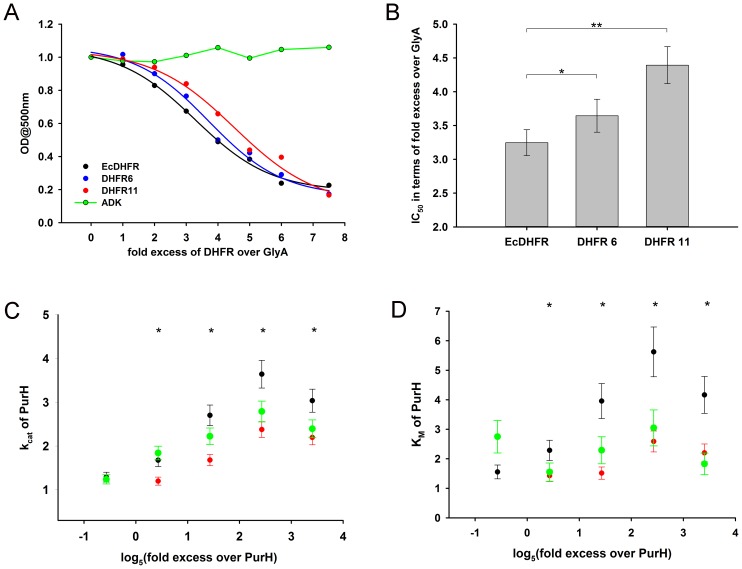
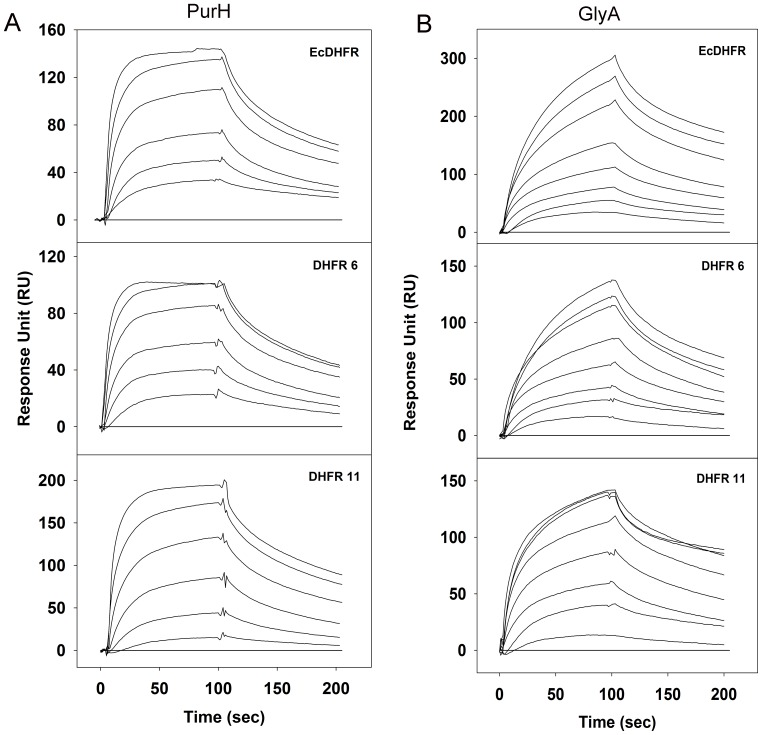
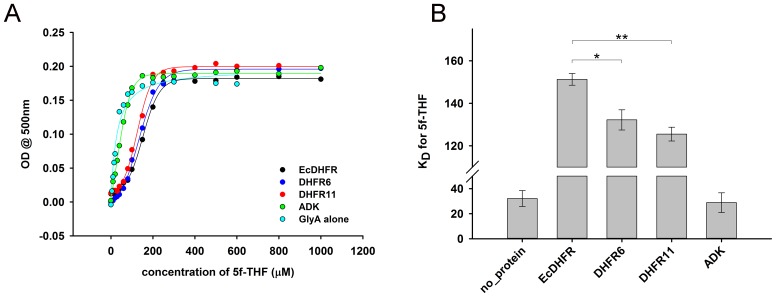
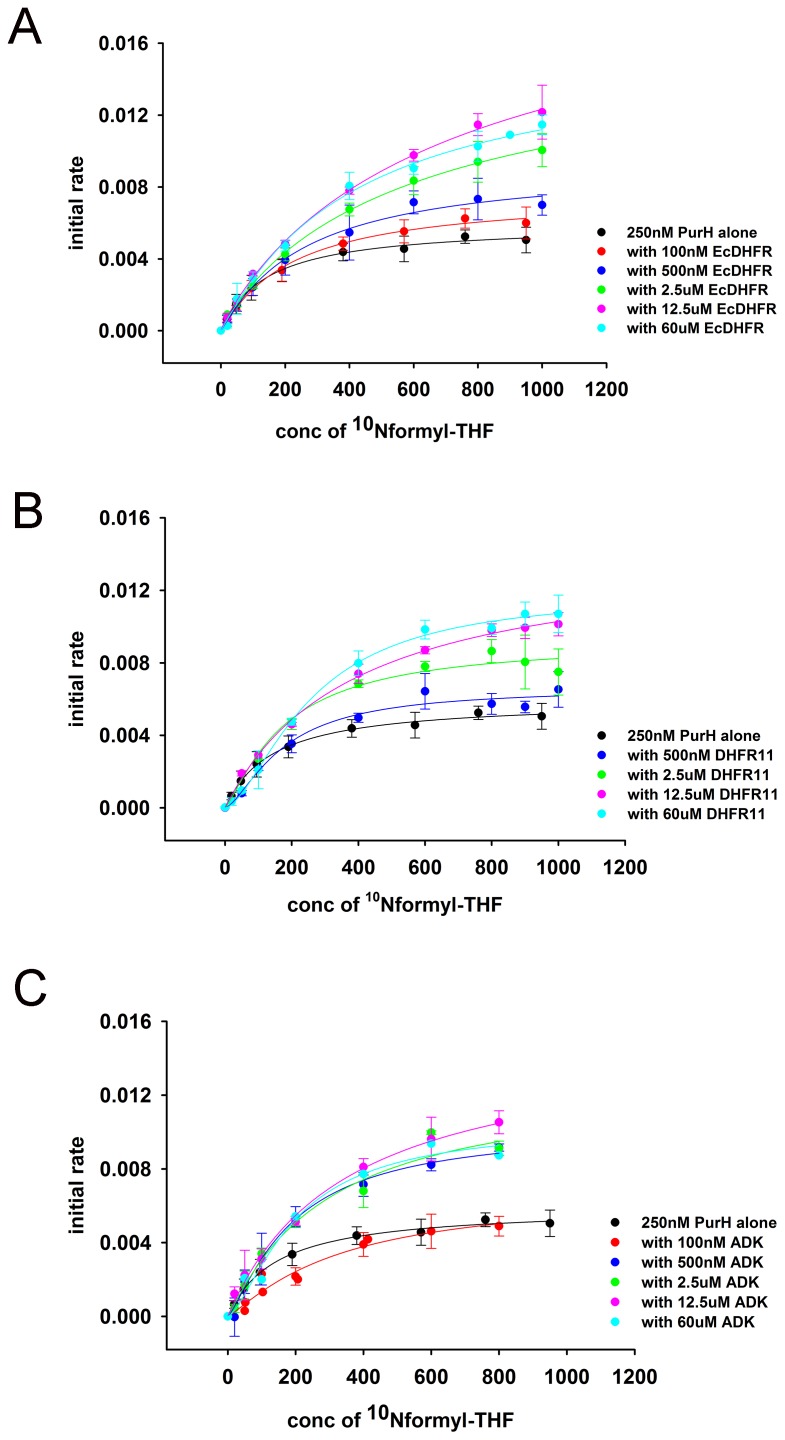
Figure 7. Compared to orthologous DHFRs, E.coli DHFR is a more potent inhibitor of GlyA and PurH.
(A) Formation of a ternary complex (GlyA-PLP+glycine + 5f-THF) was monitored at 500 nm as a function of increasing amounts of different DHFRs and the negative control protein ADK. 20 µM GlyA was pre-incubated with varying concentrations of DHFRs and ADK (zero to 150 µM) before 0.2M glycine and 200 µM 5f-THF were added to it. All data were normalized by those in the presence of an equal volume of buffer. Data were fit to a 4-parameter sigmoidal function to extract the fold excess of DHFR required to achieve 50% inhibition (IC50) as shown in panel (B). Though all DHFRs caused inhibition of GlyA compared to ADK, EcDHFR had a significantly lower IC50 than DHFR6 (* denotes p-value<0.05) and DHFR11 (** denotes p-value<0.001), explaining its higher potency in sequestering GlyA and, hence, toxicity. Catalytic rate kcat (C) and Michaelis coefficient KM (D) of PurH for 10Nf-THF measured in the presence of different DHFRs and ADK. All values were normalized relative to those of PurH measured in the absence of added protein. 250 nM of PurH was pre-incubated with varying concentrations of DHFRs or ADK (0.1 µM, 0.5 µM, 2.5 µM, 12.5 µM and 60 µM) and, subsequently, the initial rate of transfer of formyl group (AICAR transformylase activity) from 10N-formyl THF to AICAR was measured at 298 nm. For determination of kcat and KM at each concentration of a protein, the concentration of 10Nf-THF was varied from 20 µM to 1 mM, while AICAR concentration was fixed at saturation (500 µM). Each data point is an average of 3–5 independent measurements and the error bars represent standard deviation. For all proteins, kcat increased with increasing concentration of protein added, dropping off slightly at the highest concentration. The mechanism of this effect is not fully understood, but can be partially attributed to the generic crowding effect of proteins. However, only EcDHFR caused a concentration dependent increase in KM of PurH for 10Nf-THF, thereby explaining its selective toxicity upon over-expression. Statistical analyses were done to compare kcat and KM values of EcDHFR (black) and DHFR11(red), and in all cases indicated by *, the p-value was <0.05.
DOI: http://dx.doi.org/10.7554/eLife.20309.019


