
Fig. 2.
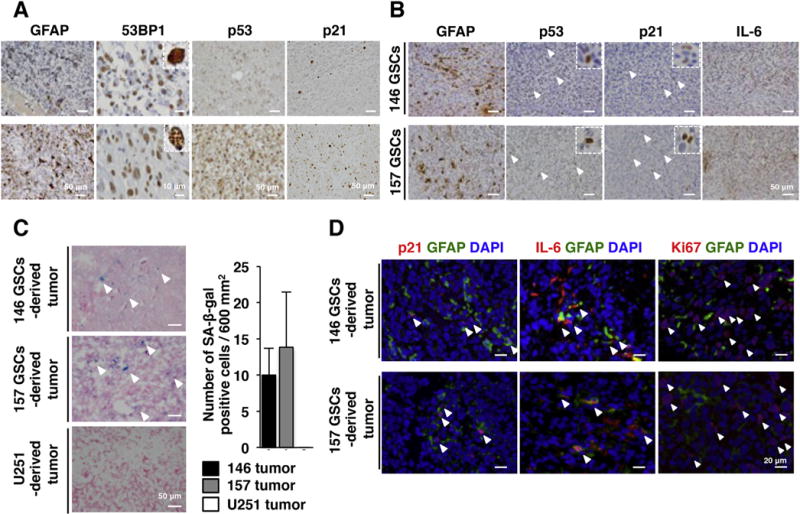
Senescent NSGCs in clinical and xenograft GBM in vivo. (A) Immunohistochemistry of human GBM tissue microarray (21–30 patient-derived tissue sections on each slide). Upper and lower panels represent the tissue sections with low and high frequencies of positive cells, respectively. In the case of 53BP1, presence of multiple nuclear foci (inset in the lower panel of 53BP1) was judged as marker-positive. (B) Immunohistochemistry of GSC-derived xenograft tumors. Each panel shows the same area derived from multiple slices of a tumor. Arrowheads indicate the antigen-positive cells. 146 GSCs and 157 GSCs mean xenograft tumors derived from GBM146 and GBM157 GSCs, respectively. (C) SA-β-gal staining of xenograft tumors. Arrowheads indicate SA-β-gal positive cells. (D) Immunofluorescence staining of GSC-derived tumors. Arrowheads indicate the p21+/GFAP+, IL-6+/GFAP+, and Ki67+/GFAP− cells, respectively. DNA was counterstained with DAPI (blue). (For interpretation of the references to colour in this figure legend, the reader is referred to the web version of this article.)