
Fig. 3.
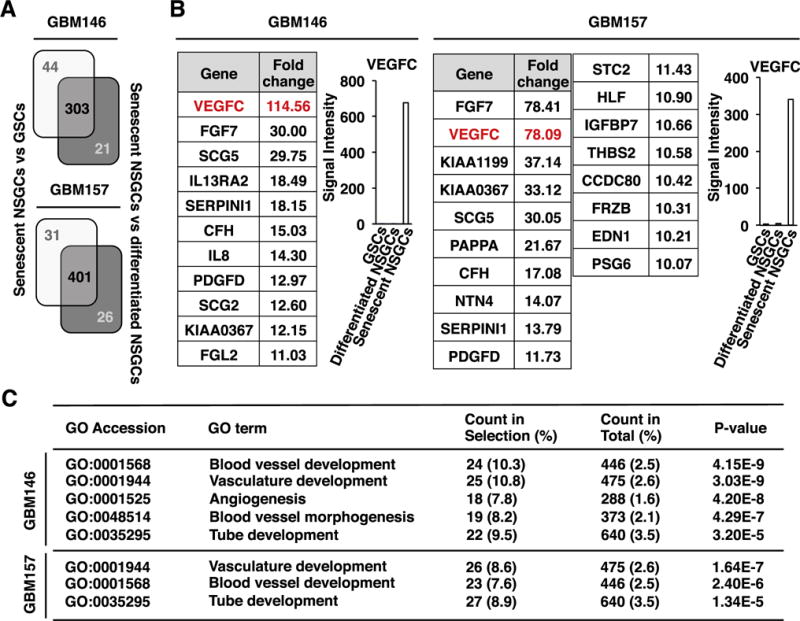
Pro-angiogenic gene expression in senescent NSGCs. (A) Gene expression profiles were compared between senescent NSGCs (day 30 after serum exposure) and GSCs, as well as between senescent NSGCs and differentiated/pre-senescent NSGCs (day 7 after serum exposure). Expression of 303 and 401 probes was upregulated >10-fold in the senescent GBM146 and GBM157 cells, respectively. (B) Signal intensities of the 10-fold-upregulated gene probes (only secretory protein-coding genes) in senescent NSGCs. Fold change indicates the ratio of signal intensity of senescent NSGCs to the average of GSCs and differentiated NSGCs. (C) Gene ontology (GO) analysis of the senescent NSGC-associated genes (P < 0.005, Fisher’s exact test).