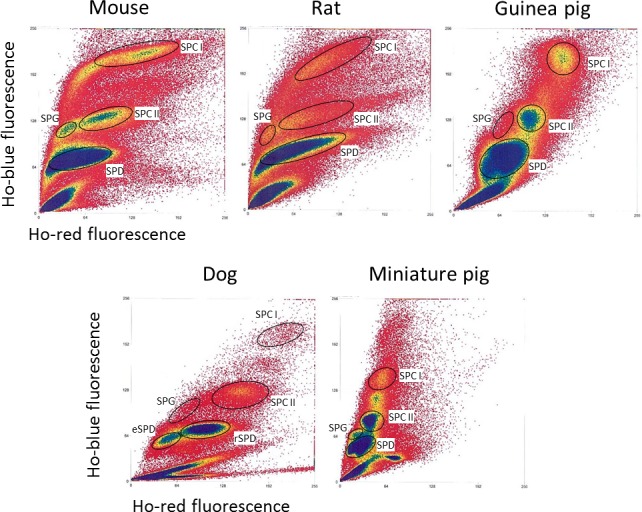
FIG. 5.

Interspecific comparison of Ho-FACS plots of testicular single-cell suspensions. The binding of Hoechst to DNA results in different FACS patterns depending on chromatin compaction and quantity. Plots represent the ratio of blue and red Hoechst fluorescence obtained by flow cytometry after testis mechanical dissociation and staining of germ cells of the mouse, rat, guinea pig, dog, and mini pig. Gating (round circles) was defined based on observed cell clusters and expected location of populations in relation to Hoechst fluorescence. A minimum of four populations were identified and sorted for all species. Ho: Hoechst.
