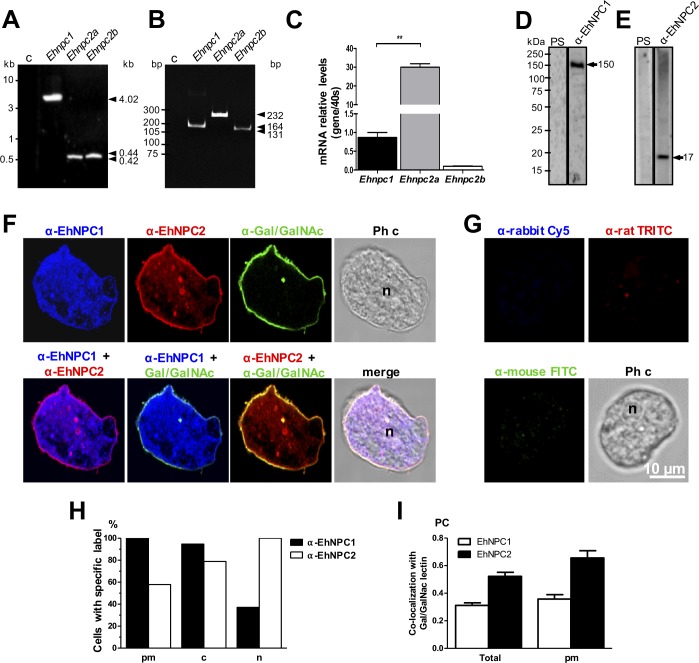
Fig 3. Expression and localization of EhNPC1 and EhNPC2 in trophozoites.
(A) Ehnpc1, Ehnpc2a and Ehnpc2b full-length genes were PCR amplified using specific primers and genomic DNA. (B) RT-PCR amplification of transcript fragments using specific primers and cDNA. c: Controls without gDNA or with mRNA as template. (C) The relative expression of the three genes was measured by RT-qPCR in trophozoites, using as a control the 40s ribosomal S2 protein gene. ** p<0.01. (D, E) Total extracts of E. histolytica were separated by 10% SDS-PAGE and analyzed by western blot assays using pre-immune serum (PS) or rabbit α-EhNPC1 (D) or rat α-EhNPC2 (E) antibodies. (F) Representative images of laser confocal microscopy of PFA-fixed trophozoites using rabbit α-EhNPC1 or rat α-EhNPC2 or mouse α-Gal/GalNAc lectin antibodies. (G) Controls using only secondary antibodies. Ph c: phase contrast images. (H) Protein localization of EhNPC1 and EhNPC2 in plasma membrane (pm), cytoplasm (c) or nucleus (n). Counts were performed in 50 cells. (I) Pearson coefficient (PC) correlation measured in at least 15 confocal images, indicating co-localization of EhNPC1 or EhNPC2 with Gal/GalNAc lectin in the entire cell and in the plasma membrane. Laser sections = 0.5 μm.

