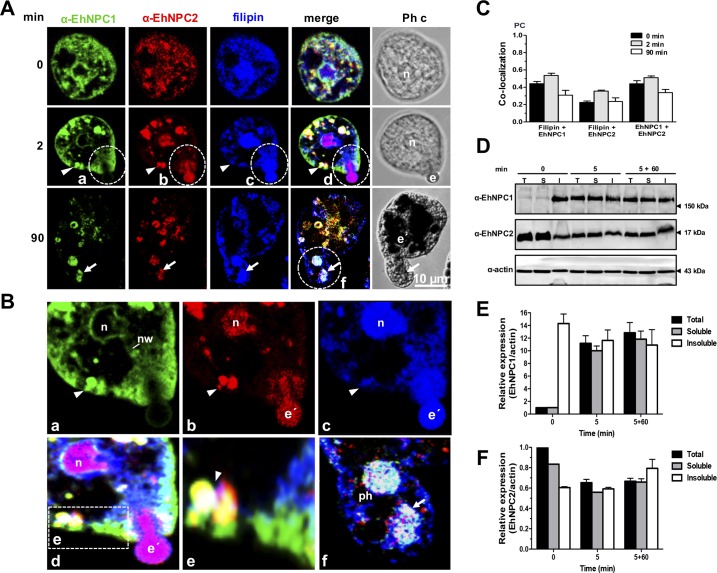
Fig 7. Localization of EhNPC1, EhNPC2 and cholesterol during phagocytosis.
(A) Trophozoites were incubated with erythrocytes (1:25) at 37°C, for the indicated times. Then, samples were prepared for laser confocal microscopy and stained with filipin, rabbit α-EhNPC1 and rat α-EhNPC2 antibodies and secondary antibodies. Ph c: phase contrast images, e’: erythrocytes, n: nucleus. Arrow head: cytoplasmic vesicles. (B) (a-d) Dotted circles: Magnification of an erythrocyte that is being internalized. (e) Magnification of vesicles close to the plasma membrane. (f) Magnification of a huge phagosome (ph) containing digested erythrocytes (arrows). nw: networks. (C) PC of the co-localization between filipin and EhNPC1 or EhNPC2 or EhNPC1 with EhNPC2 at distinct phagocytosis time. (D) Trophozoites were incubated with erythrocytes at 37°C for 5 min, then adherent and non-ingested erythrocytes were removed by washing with a mixture of water-TYI medium. Later, trophozoites were incubated at 37°C again for 60 min with TYI to continue the process. Trophozoites were lysed and also cellular fractionation was carried out. Samples were processed for 12% SDS-PAGE and western blot assays. Representative blots of three experiments are shown. T: total extracts, S: soluble fraction, I: insoluble fraction. (E,F) Densitometry of the bands in (D) corresponding to EhNPC1 (E) and EhNPC2 (F) using actin as loading control.

