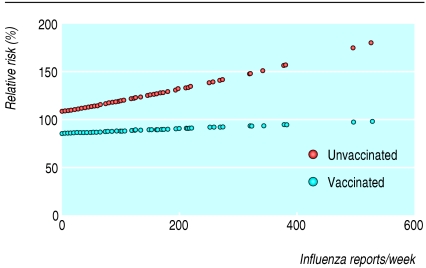
Figure 1.
Mortality versus population influenza rate by vaccination status. Fitted regression lines for daily mortality by number of specimens with influenza A reported in the United Kingdom during the previous week, using Poisson model controlling for month, temperature, and number of days since 31 December. Mortality is scaled to be relative to the total cohort average

