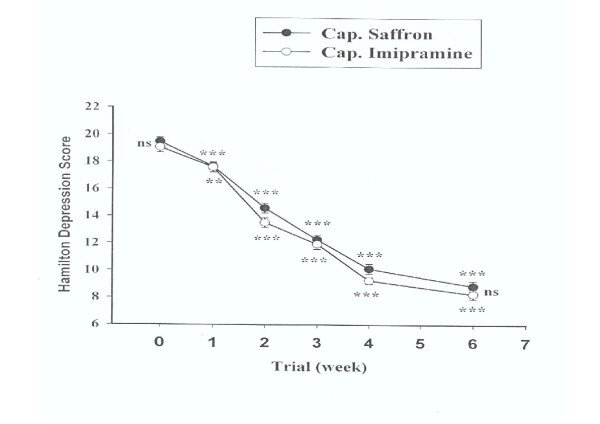
Figure 1.
Mean ± SEM scores of two groups of patients on the Hamilton Depression Rating Scale. ns = non-significant, ** = P < 0.01 and *** = P < 0.001. The horizontal symbols (** and ***) were used to express statistical significance versus their respective baseline value and ns symbols are for between group comparisons.

