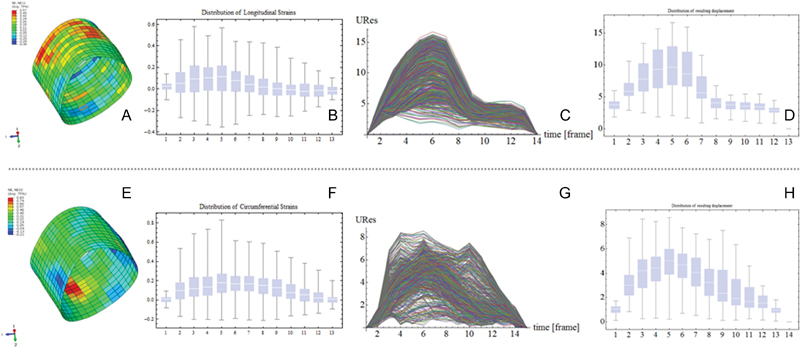
Fig. 2.

Results after infinite element analysis of 3D speckle tracking recording of the aortic part of interest. (A) Colored feature of the longitudinal and (B) distribution along the aortic root is shown. (E) Same feature and (F) distribution are seen for the circumferential strain. Final overall resulting displacement time related (C, G) and its distribution (D, H) between normal (C and D) and enlarged (G and H) aortic roots.
