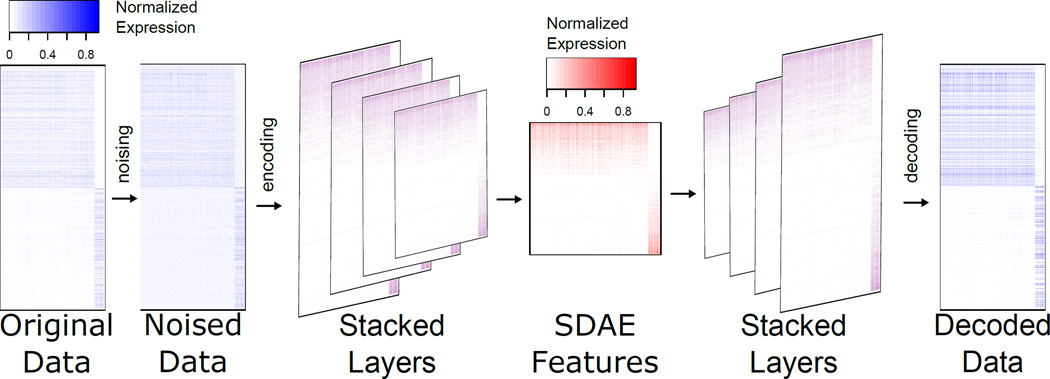
Fig. 2.
SDAE representation using the enriched genes in the TCGA breast cancer. In this depiction for illustrative purposes, the top 500 genes with median expression across cancer samples enriched above health samples, and the top 500 genes with reduced median expression across cancer samples is shown.

