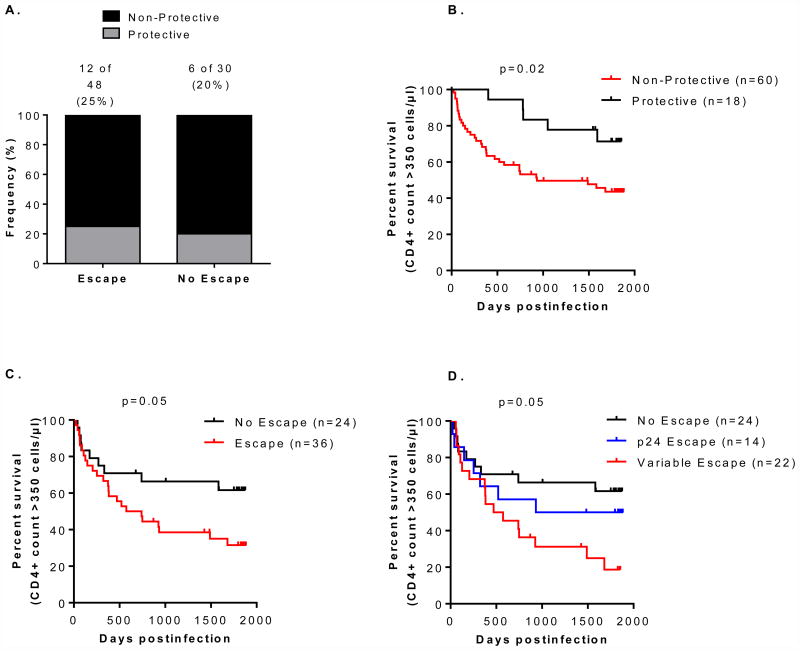
Figure 3.
Panel A) Distribution of protective HLA alleles (HLA B*57, B*58:01 and B*81) between the two groups (escape and no escape). Panel B) Association between protective HLA alleles and CD4+ decline to <350 cells/μl. Panel C) Association between HLA-associated escape mutations and CD4+ decline to <350 cells/μl in individuals with non-protective HLA alleles. Panel D) Association between no escape, HLA-associated escape mutations in conserved (p24) and in variable (p17 and p7p6) Gag proteins, and CD4+ decline to <350 cells/μl in individuals with non-protective HLA alleles.

