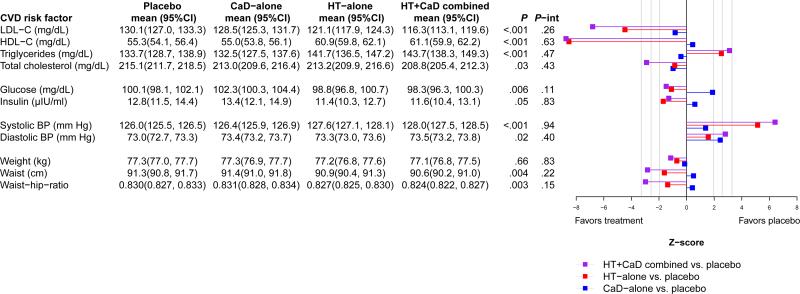
Figure 2.
Average group means (95%CI) during follow-up and corresponding Z-scores of treatment group effects. Group means for each randomization group were obtained by averaging the follow-up mesurements collected at years 3 and 6. HT indicates menopausal hormone therapy; CaD, calcium plus vitamin D; P, the p-value of the 3 degree-of-freedom test for the main-effect of randomization group; P-int, p-value of the 1 degree-of-freedom test for interaction.

