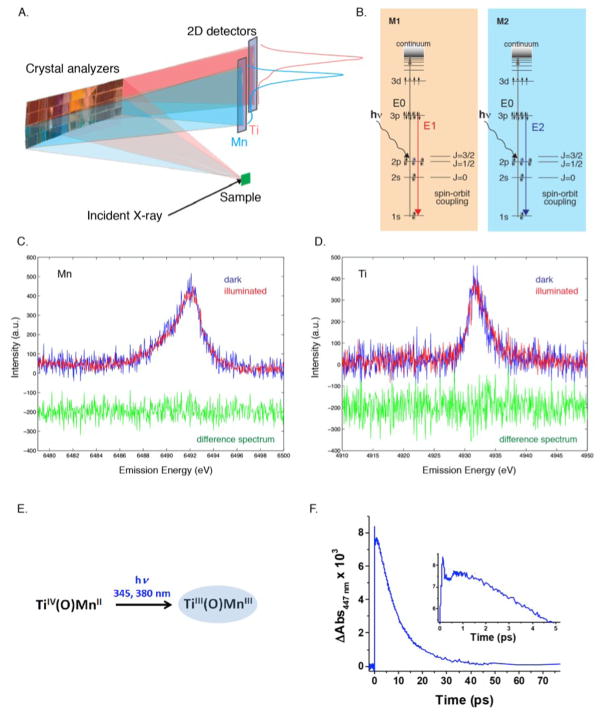
Figure 6.
A. The schematic shows the method used for simultaneous collection of the emission spectra from two elements, Mn and Ti, using an energy dispersive X-ray spectrometer and a 2D detector. B. Energy level diagram showing the excitation. E1 and E2, and Kβ emission processes for Mn and Ti. C. Mn Kβ1,3 spectra of the Mn/Ti molecular compound in the dark (blue) and illuminated (1.2 ps) (green). D. Ti Kβ1,3 of the Mn/Ti molecular compound in solution in the dark (blue) and illuminated (1.2 ps) (red). The difference spectra are shown in green. E. Expected changes of the metal oxidation states during the MMCT. F. Transient absorption spectroscopy of Mn/Tn molecular compound in liquid.

