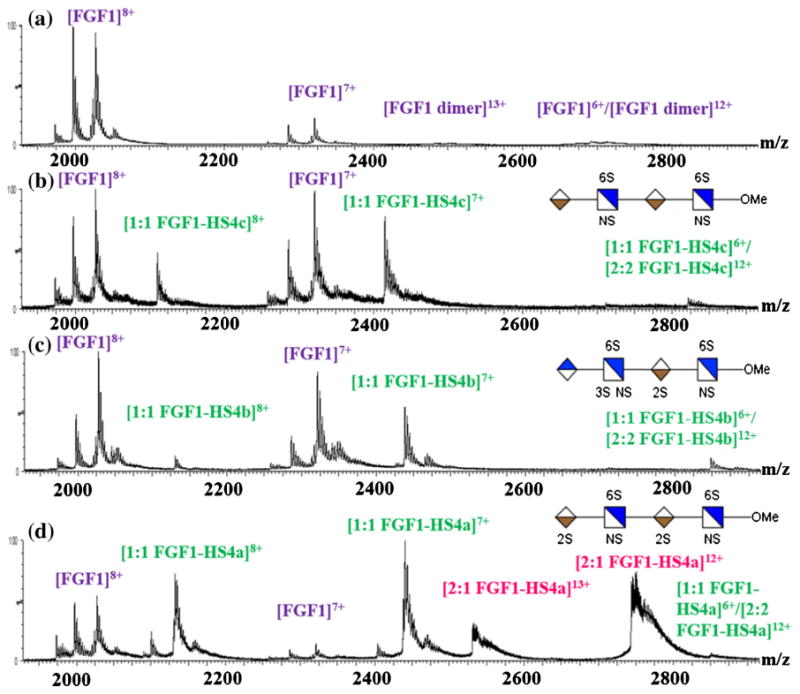
Figure 1.

ESI mass spectra, obtained under nondenaturing conditions, of (a) FGF1 itself; (b) FGF1 incubated with HS dp4c at 2:1 ratio; (c) FGF1 incubated with HS dp4b at 2:1 ratio; (d) FGF1 incubated with HS dp4a at 2:1 ratio. Associating of two FGF1s by one HS (2:1 FGF1–HS complex) were observed only for the HS dp4a containing the high affinity binding motif
