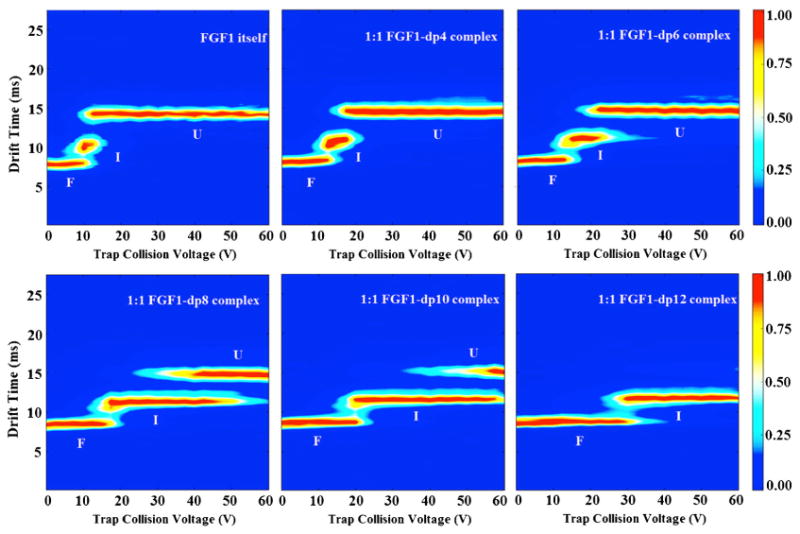
Figure 5.

The 2D-contour CIU fingerprint of the monomeric apo-FGF1 and the 1:1 FGF1-HS, with HS of increasing length from dp4-dp12. The conformations were labeled as F, I, and U, indicating folded, intermediate, and unfolded states, respectively. The ion intensities are indicated by a color axis. As the length of the HS increases, they form complexes with FGF1 and increase the conformational stability of the complexes accordingly
