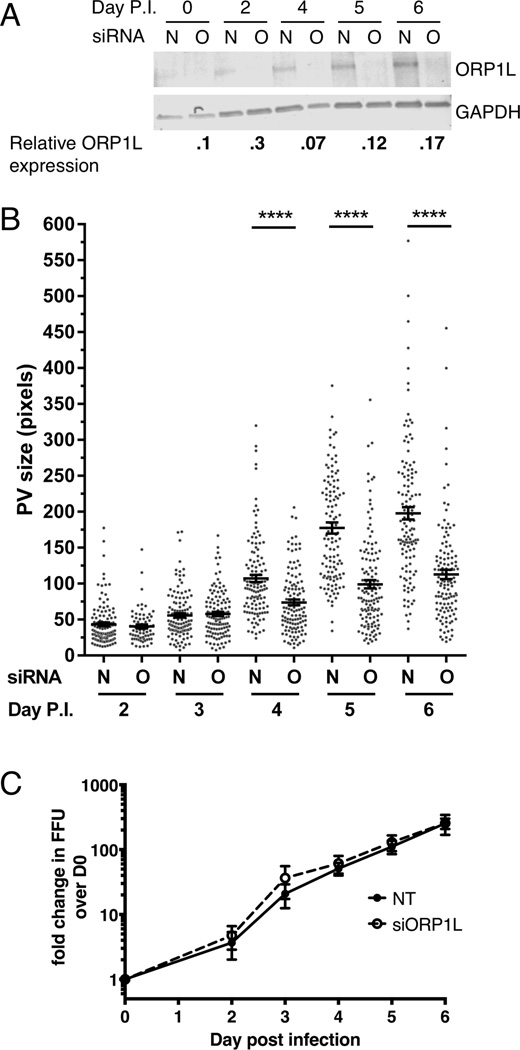
Figure 6. Depletion of ORP1L results in smaller PVs.
HeLa cells were treated with siRNA and then infected 2 days later (day 0 post infection (p.i.)). Infected cells were re-transfected with siRNA at 0 days p.i., and samples processed for immunoblotting, immunofluorescence, or growth assays. (A) ORP1L protein expression in cells treated with either non-targeting (N) or ORP1L siRNA (O) over a six day C. burnetii infection. Cell lysates were immunoblotted and ORP1L protein levels quantitated by normalizing to the loading control GAPDH. ORP1L protein levels remained less than 30% of the non-targeting control for the duration of the experiment. Shown is a representative blot from 6 experiments. (B) PV measurements in cells with either wild type or depleted ORP1L. At various times post infection, coverslips were fixed with paraformaldehyde and the PV membrane stained with anti-CD63 and anti-C. burnetii. The PV size was determined using ImageJ and standard error of the mean determined by ordinary one-way ANOVA with Sidak’s multiple comparisons test. The scatter plot shows individual PV measurements from three independent experiments, with at least 30 PVs per condition in each experiment. Bars indicate average ± SEM. **** = p<0.0001. (C) C. burnetii growth in ORP1L-depleted cells is similar to control cells. The number of viable bacteria was determined by fluorescent foci unit (FFU) assay at the days indicated, and normalized to day 0 to determine fold change in bacterial growth. The results are expressed as the mean of three experiments done in duplicate. Error bars represent SEM.

